How to Read Google Search Console and GA4 Data: 10 Things Every SEO Should Check (and How to Fix What You Find)
Google Search Console and Google Analytics 4 answer two different questions. Search Console tells you what happened before someone clicked: whether Google could find your page, whether it chose to index it, which searches showed it, and which sites link to it. GA4 tells you what happened after the click: whether the visitor stayed, read, and did anything useful. Most of the reporting mistakes I see in SEO come from asking one tool a question that only the other one can answer.
This guide covers the 10 places I look when I open a site’s data, in the order I look at them. For each one you’ll get where to find it, what normal looks like, the red flags that mean something is wrong, and what to do about each red flag. I’ve been building backlinks for more than 11 years, so the Links report gets more attention here than it does in most guides. That’s on purpose. It’s the report that tells you which pages need authority, and it’s the one most SEOs skip.
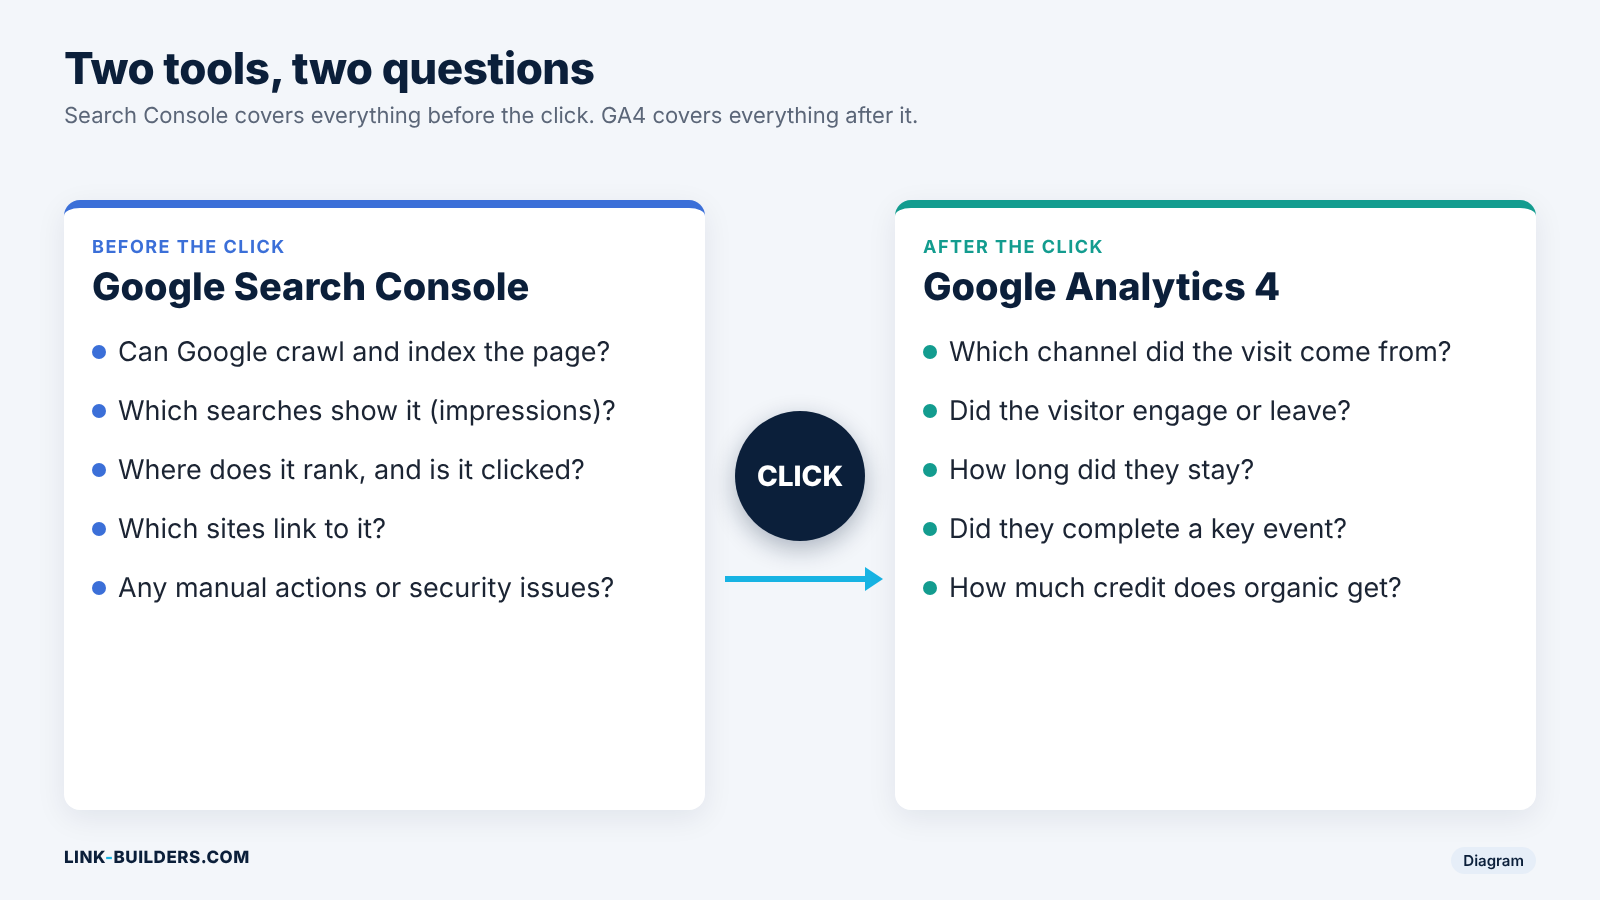
Search Console covers everything before the click. GA4 covers everything after it.
There’s another reason to revisit these tools now. Search Console has changed more in the past year than in the five years before it. Google added a branded queries filter, query groups, AI-powered report configuration, and reports for AI Overviews and AI Mode. GA4 added a dedicated channel for traffic from AI assistants. Most of the guides still ranking for this topic were written before any of that existed.
If you’re new to Search Console, start with Google’s own getting started guide, then come back here.
Before You Start: Three Setup Checks
Bad setup quietly ruins every report that follows, so check these three things first.
Use a Domain Property
Search Console offers two kinds of property. A URL-prefix property only covers the exact address you enter, so `https://www.example.com` won’t include `http://example.com` or a blog on a subdomain. A Domain property covers all of them in one view. If you only have a URL-prefix property, add a Domain property through DNS verification. Some reports, including Crawl Stats, only work on a property at the root level.
Connect Search Console to GA4
Linking the two tools adds a Search Console collection to GA4, with reports that show organic queries next to landing page engagement. Google explains how in its guide to connecting Search Console to Google Analytics. You’ll need Editor access in GA4 and verified owner access in Search Console. One web data stream can link to only one Search Console property, so link the Domain property if you have one.
Annotate What Happens to the Site
Search Console now lets you add custom annotations to its charts. Use them for site launches, migrations, template changes, the start of a link campaign, and Google updates. Six months from now, a note on the chart will save you an afternoon of guessing.
Annotations also help with a problem people rarely think about: sometimes the data itself is wrong. In August 2026, Search Console’s performance reports showed a sharp drop in impressions and clicks starting around August 12. Google confirmed it was a logging issue, not a real loss of visibility. Anyone who reacted to that chart by rewriting pages was fixing a problem that didn’t exist.
Part 1: Google Search Console
1. The Performance Report
Start with the trend, and compare time periods before you look at any single query. A number by itself tells you almost nothing. A number next to the same number from last year tells you a lot.
Where to Find It
Go to Performance, then Search results. Turn on all four metrics: total clicks, total impressions, average CTR and average position. Then open the date filter and choose Compare. Comparing the last three months with the same three months last year removes most seasonal swings. Google’s Performance report guide explains each metric and filter in detail.
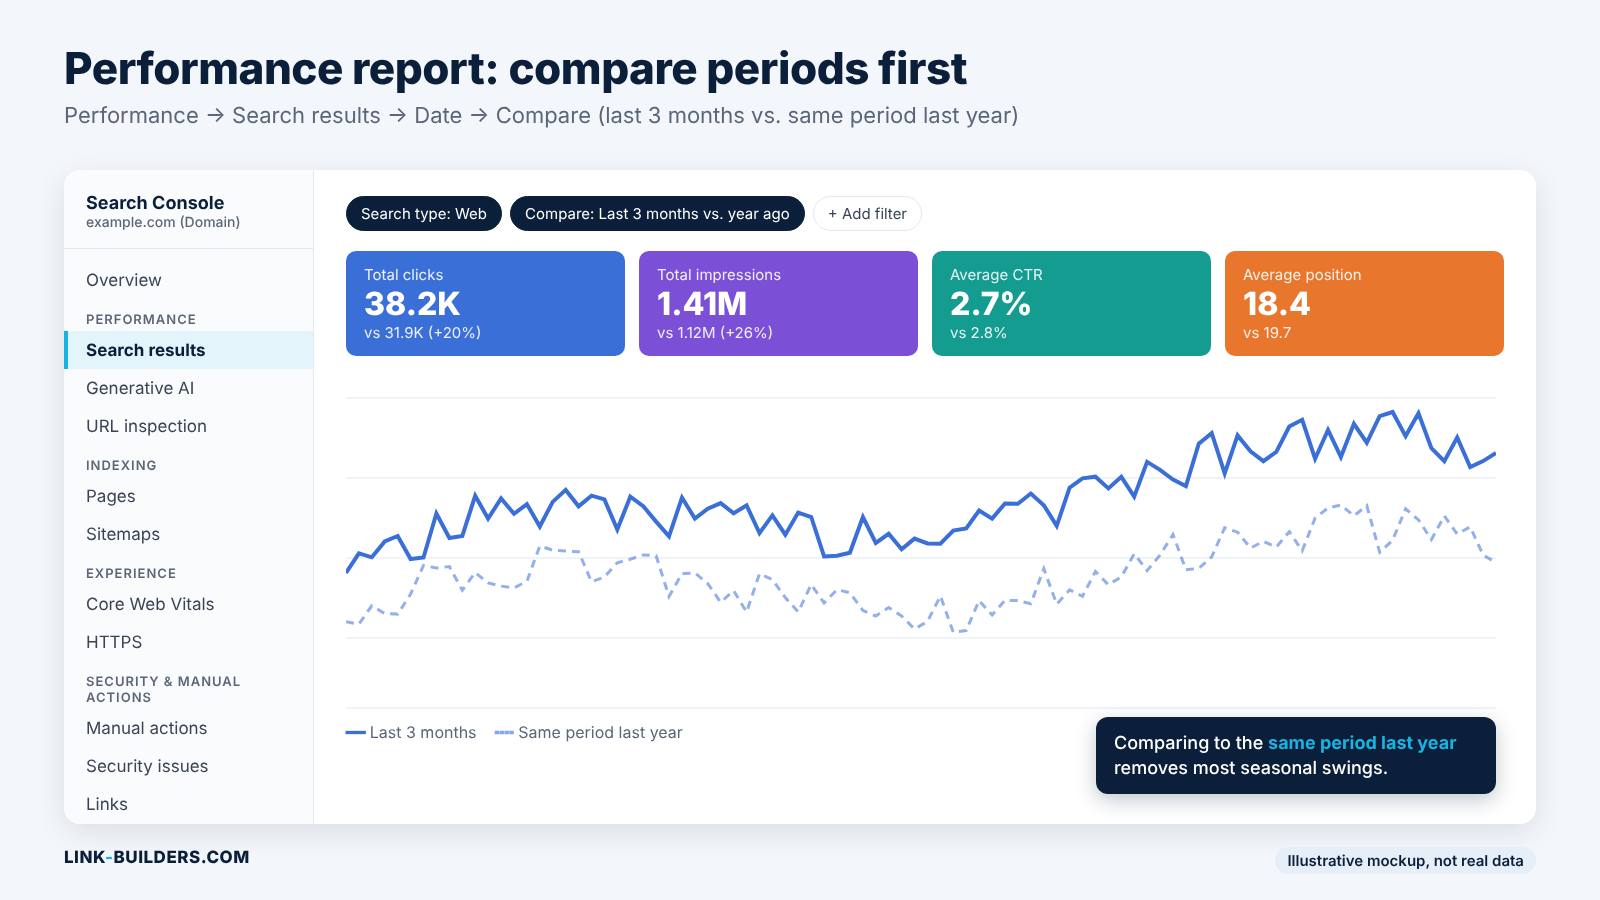
Compare against the same period last year to remove seasonality.
The report also offers an hourly view and a 24-hour view. Those are handy for checking a page right after you change it, but don’t make decisions from them. Short windows are noisy.
What Normal Looks Like
On a healthy site, impressions and clicks move together. You’ll see gentle seasonal waves and slow growth as content and links build up. Average position is an average across every query and page you appear for, so a new page that ranks on page five for hundreds of terms can pull it down even while traffic rises. Treat it as a rough signal, not a score.
Red Flags
Impressions rising while clicks stay flat. This isn’t always bad. It often means you’re showing up for more searches with low click intent, or appearing more often in AI Overviews, where people get their answer without clicking. Check which queries gained impressions before you worry.
Clicks and impressions dropping sharply on a single date. A cliff on one specific day usually has one specific cause: a Google update, a manual action, a technical failure such as a misplaced noindex tag, or a reporting error.
Non-branded clicks falling while branded clicks hold steady. This is the most useful early warning in the whole report, and the new branded queries filter makes it easy to spot. People searching for your name will find you no matter what. People searching for what you sell are the ones you earn through SEO. If that second group shrinks, your rankings are slipping, even if the total looks fine.
How to Fix It
For a sudden drop, work through the possible causes in a set order. Google’s guide to debugging drops in Search traffic lists them: algorithm updates, technical issues, security problems, spam violations, seasonality, site migrations and reporting errors.
- Check the Google Search Status Dashboard for an update that started on or near the date of your drop.
- Check Manual actions and Security issues (section 7 below).
- Check the Page indexing report for a spike in excluded pages (section 3).
- Compare the drop by page and by query to see whether it hit the whole site or one group of pages.
If an update lines up with your drop, read what Google says that update targets in its ranking systems guide. I wrote a full walkthrough for the most recent one in my breakdown of the September 2026 spam update, including how to tell a spam update hit from a core update hit in your Search Console data.
If the problem is a slow slide in non-branded clicks, the fix is usually a mix of content and authority, which the next section covers. Branded search matters for SEO in its own right, too. I looked at how Google treats it in my article on Google’s click and brand search patents.
2. Queries and Pages: Where the Quick Wins Are
If you only have an hour a month for Search Console, spend it here. Three filters in this report find most of the pages worth working on.
Where to Find It
Stay in the Performance report and switch between the Queries tab and the Pages tab. The most useful move is to click a single page, then switch to Queries. That shows you every search that page appears for. Search Console Insights also groups similar searches into query groups, which helps on sites with thousands of long-tail queries.
What Normal Looks Like
Click-through rate drops as position drops. A page at position one gets far more of its impressions as clicks than a page at position eight. Each important query should be owned by one page on your site.
Red Flags
High impressions with a low CTR. Sort queries by impressions, then look for rows where the CTR is well below what the position would suggest. Either your title and snippet aren’t earning the click, or something on the results page, like an AI Overview or a featured snippet, is answering the question first.
Striking distance pages. Filter for an average position between 8 and 20. These pages already rank on the bottom of page one or the top of page two. Google sees them as relevant. They just aren’t strong enough to move up yet.
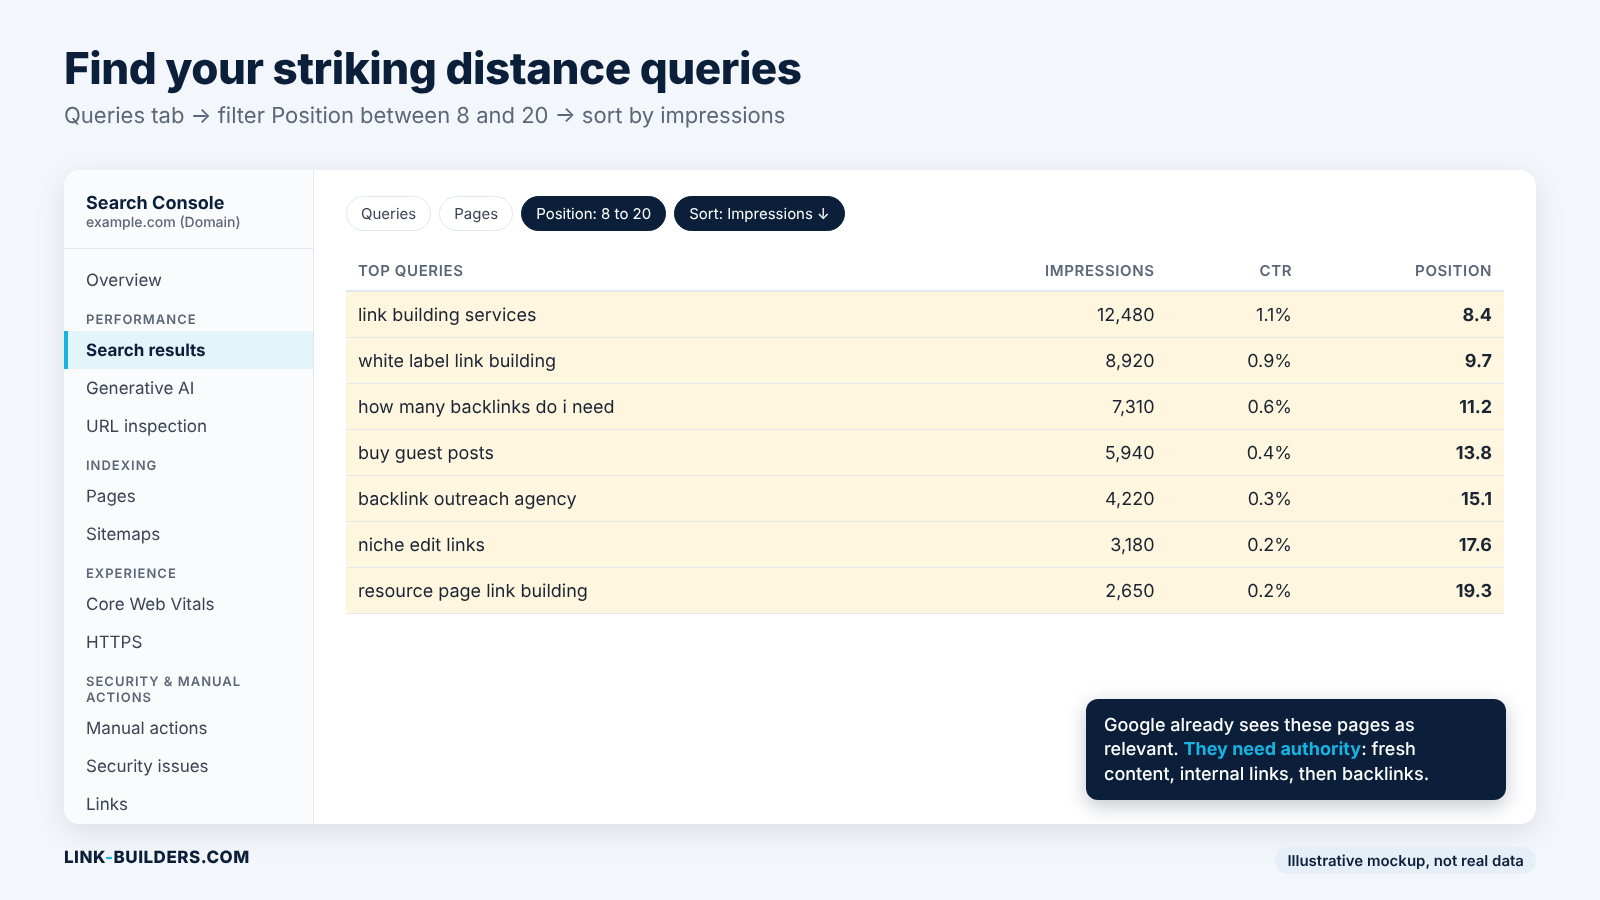
Pages ranking between 8 and 20 are the shortest path to more traffic.
Cannibalization. Click a query and switch to the Pages tab. If two or more of your pages show up for the same query and trade places from week to week, they’re competing with each other, and Google can’t settle on which one deserves to rank.
How to Fix It
For low CTR, rewrite the title and meta description to match what the searcher actually wants. Google explains how it picks title links and snippets, including when it rewrites them. If an AI Overview is taking the clicks, look at what it says and add the specific detail it leaves out.
For striking distance pages, do three things in this order. First, refresh the content so it fully answers the queries the page already ranks for. Second, add internal links to it from your strongest pages. Third, point new backlinks at it. In my experience these are the pages where link building pays off fastest, because Google already considers them relevant. If you’re not sure how many links a page needs to move, I covered that in how many backlinks you actually need. To see what the pages above you have that you don’t, run a competitor backlink comparison. My guide to analyzing competitor backlinks with AI walks through it, and my Semrush vs. Ahrefs comparison covers which tool does it better.
For cannibalization, pick one page per search intent. Merge the weaker page into the stronger one and redirect it, or set a canonical tag if both need to exist. Google’s guide to consolidating duplicate URLs explains the options.
For a broader tour of every filter in this report, Search Engine Land’s SEO guide to Google Search Console is a good companion.
3. The Page Indexing Report
A page that isn’t indexed can’t rank, no matter how good it is or how many links point to it. But not every page should be indexed, and that’s the part people get wrong.
Where to Find It
Go to Indexing, then Pages. The chart shows indexed and not-indexed pages over time, and the table below lists each reason a page wasn’t indexed. Use the filter at the top to view only the URLs in your sitemap. That narrows the report to the pages you actually care about.
What Normal Looks Like
Plenty of “not indexed” URLs is normal. Redirects, pages with a canonical pointing elsewhere, and pages you’ve deliberately marked noindex all belong there. Google’s Page indexing report guide says plainly that not every URL on your site should be indexed. What matters is whether the pages you want in search are there.
Red Flags
“Crawled, currently not indexed” on important pages. Google visited the page and decided not to index it. This is usually about quality or uniqueness. The page may be thin, too close to another page, or not very useful compared with what’s already in the index.
“Discovered, currently not indexed.” Google knows the URL exists but hasn’t crawled it yet. Common causes are weak internal linking, a large site with limited crawl capacity, or a server that slows down under load.
“Duplicate without user-selected canonical” or “Duplicate, Google chose different canonical than user.” Google found several versions of the same content and either picked one on its own or overruled your choice.
Soft 404s, server errors (5xx) and redirect errors. Soft 404s are pages that return a normal status but look empty or missing. Server errors and redirect loops stop Googlebot outright.
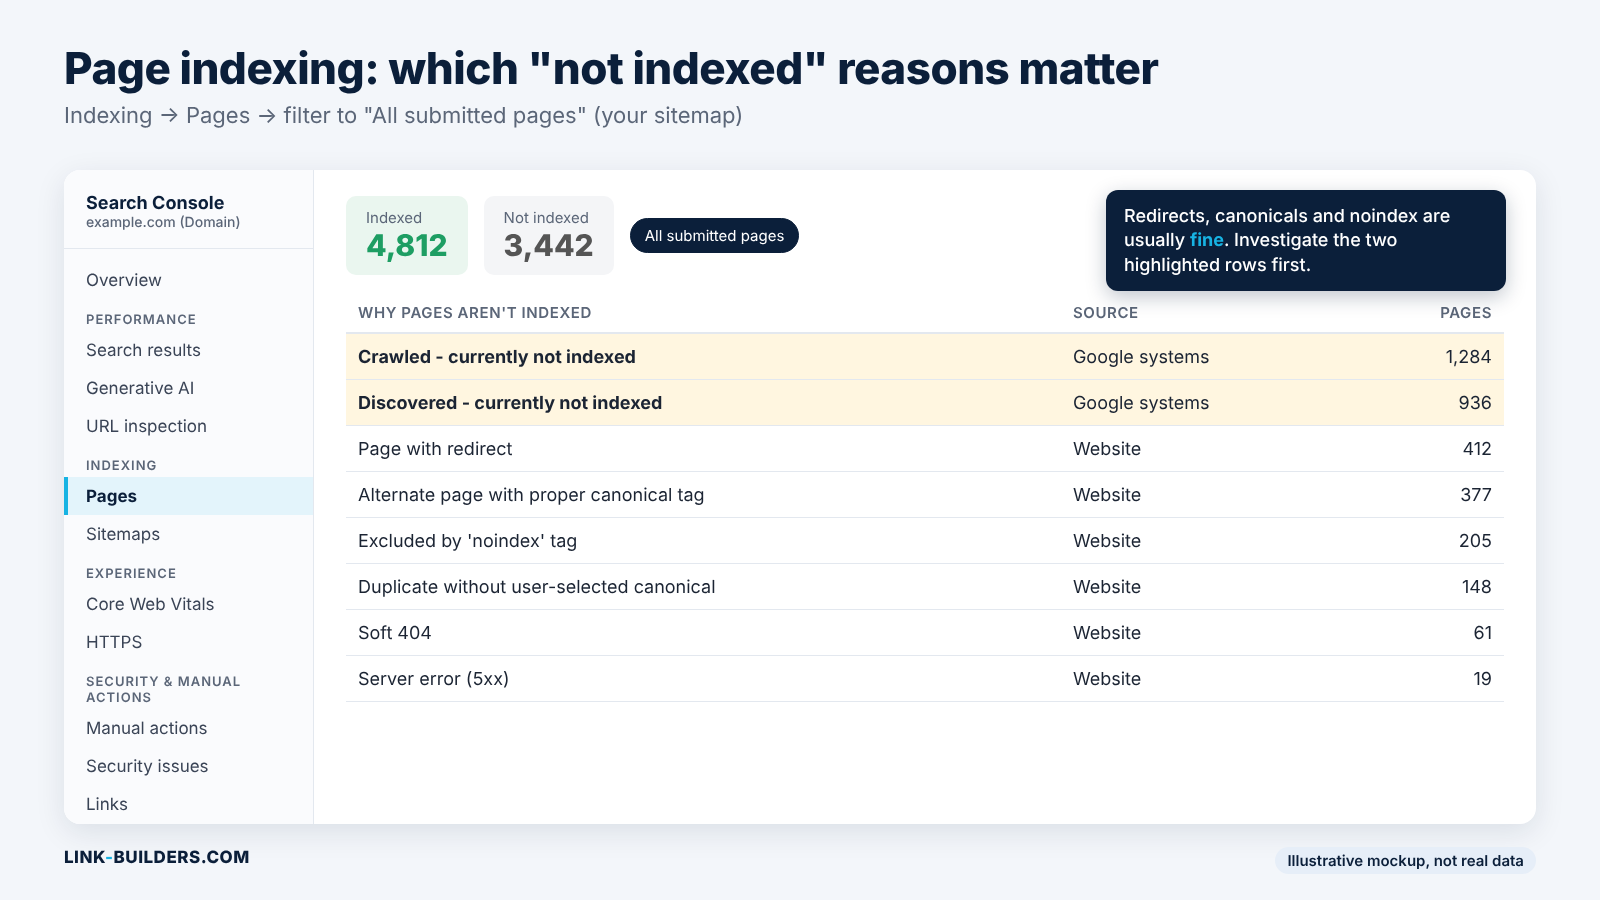
The two “currently not indexed” reasons deserve the most attention.
How to Fix It
For crawled but not indexed pages, improve the page or merge it into a stronger one. Ask whether it offers something the other pages on the same topic don’t. Google’s guide to creating helpful, people-first content is the standard to measure against, and I wrote about how those guidelines apply in practice in Google’s guidelines for user-first content.
For discovered but not indexed pages, link to them from pages Google already crawls often, like your homepage, category pages and most-linked articles. Google’s guidance on crawlable links explains what Googlebot can follow. External links help here too, since a link from another site is another path for Googlebot to find the page.
For duplicates, set a clear canonical tag on each version, make sure your internal links point to the version you want, and keep only the canonical version in your sitemap.
For errors, fix the server or redirect problem first. Google’s page on HTTP status codes and network errors explains how it treats each one.
After any fix, click Validate Fix in the report. Validation can take up to about two weeks, and Google emails you as it progresses.
4. URL Inspection, Sitemaps and Crawl Stats
These three tools answer one question together: can Googlebot reach your pages, render them, and understand them?
Where to Find Them
The URL Inspection tool is the search bar at the top of every Search Console screen. Sitemaps is under Indexing. Crawl Stats is under Settings.
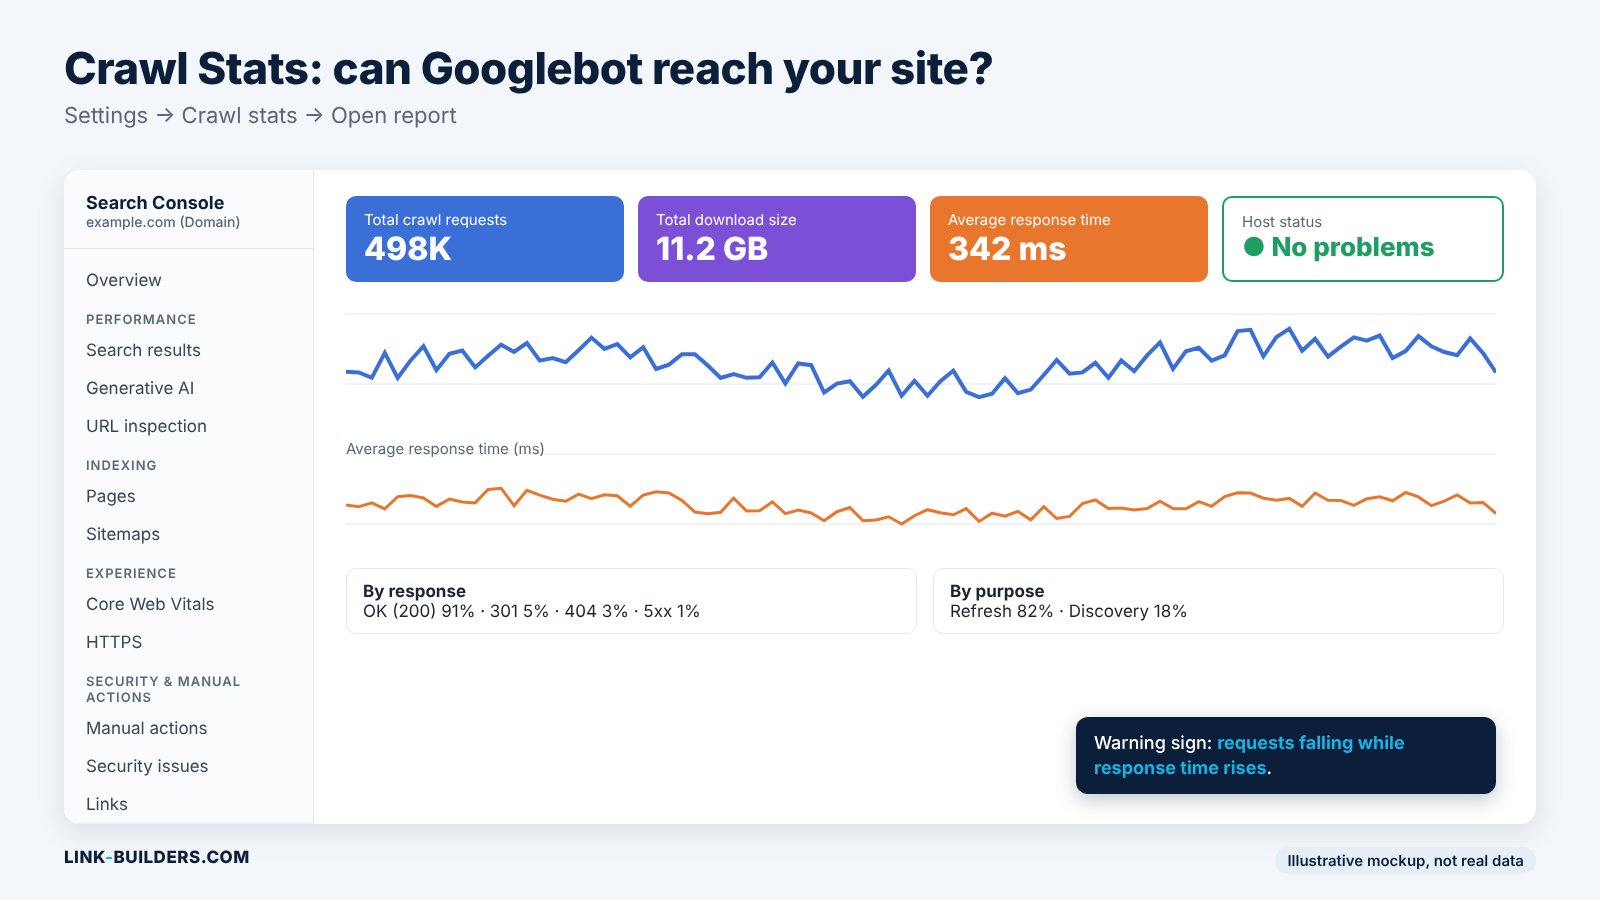
Crawl Stats sits under Settings, which is why many SEOs never find it.
What Normal Looks Like
Your sitemaps show a status of Success. In Crawl Stats, most responses are 200 (OK), response times are steady, and host status is green. A URL inspection of an important page says the URL is on Google, with the canonical you expect.
Red Flags
A live test that doesn’t match what you see. If the URL Inspection live test shows a different canonical, blocked resources, or a rendered screenshot missing your main content, Google is seeing a different page than your visitors are.
Sitemap problems. A status of “Couldn’t fetch,” or a sitemap full of redirected, noindexed or broken URLs. A sitemap should be a list of pages you want indexed. If it’s full of other things, Google learns to trust it less.
Crawl problems. Crawl requests falling while average response time climbs, or host status warnings about robots.txt, DNS or server connectivity.
How to Fix It
Clean your sitemap so it lists only indexable pages that return a 200 status. Google’s sitemaps overview and the Sitemaps report guide cover format and errors. For slow responses or host warnings, talk to your developer or host about server capacity. On large sites, Google’s guide to managing crawl budget is worth reading in full. The Crawl Stats guide notes the report is aimed at advanced users, and that sites under about 1,000 pages usually don’t need it.
Only use Request Indexing after you’ve actually fixed something. Requesting it repeatedly for an unchanged page does nothing. One more caution from Google’s URL Inspection guide: “URL is on Google” means the page is eligible to appear in search. It doesn’t check manual actions or quality, and it doesn’t promise the page will rank.
5. The Links Report
This is the section I care about most, because it connects everything above to the question every site eventually has to answer: which pages need more authority, and where should it come from?
The Links report doesn’t show every link to your site. It shows a sample. But it’s Google’s own sample, which no third-party tool can claim, and it’s enough to spot the problems that matter.
Where to Find It
Click Links in the left menu. You’ll see four tables: top linked pages from external links, top linking sites, top linking text (your anchor text), and top linked pages from internal links. You can export up to 100,000 rows, either as “Latest links” or “More sample links.” Google’s Links report guide explains each table.
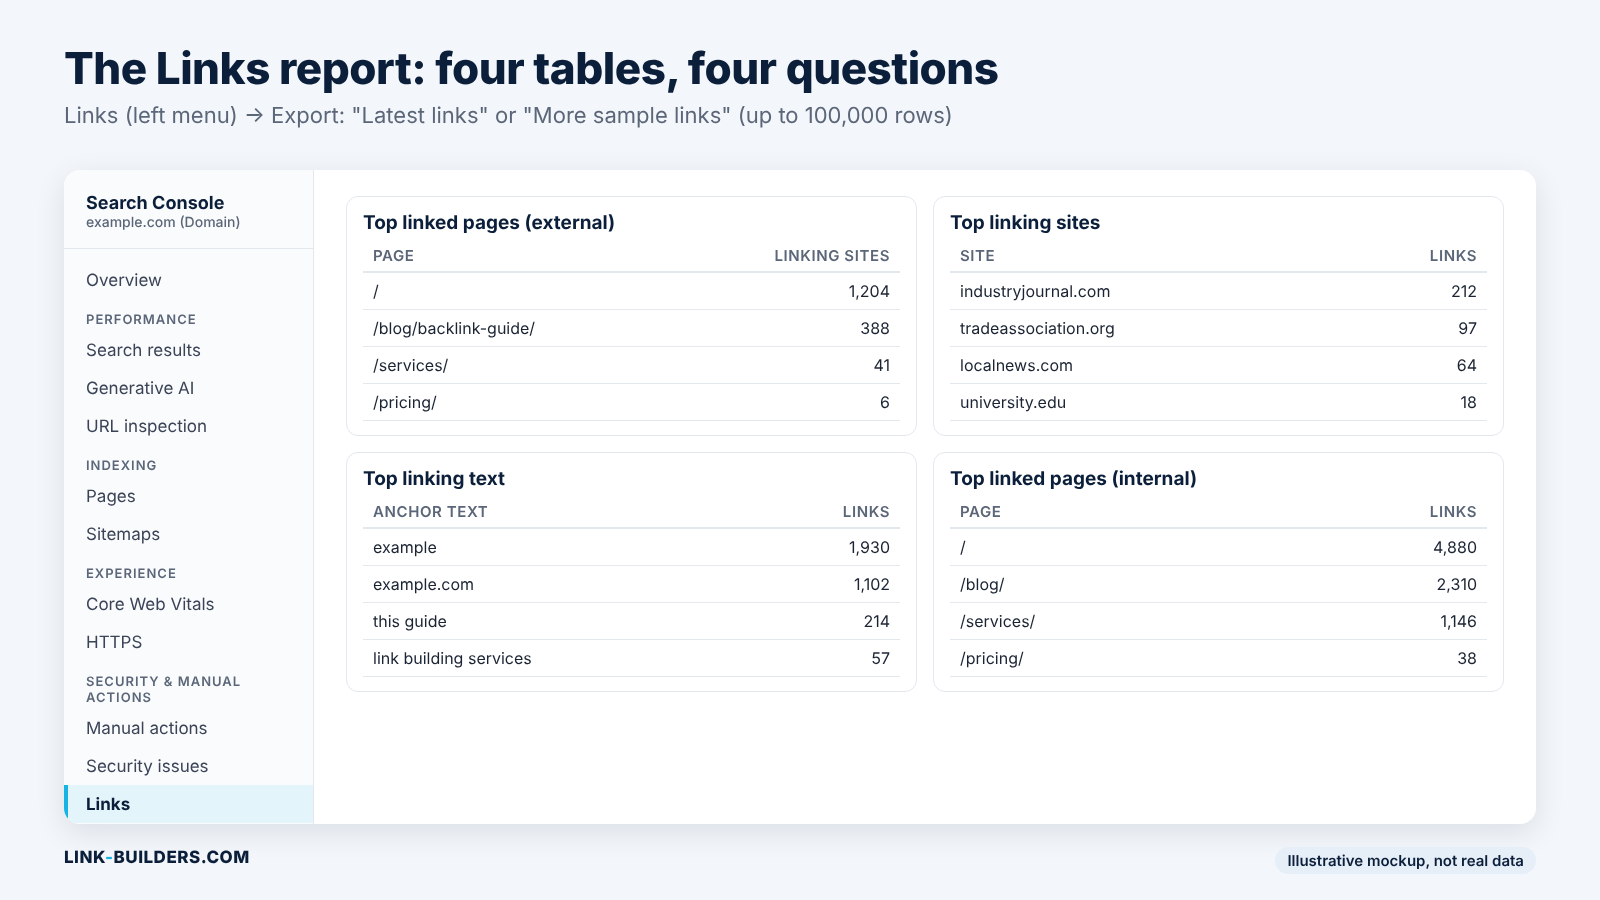
Four tables, each answering a different question.
What Normal Looks Like
On a healthy site, the homepage and your best content earn most of the external links. Most anchor text is your brand name, your URL, or plain phrases like “this guide.” The top linking sites are related to your topic. In the internal links table, your most important pages have the most internal links.
Red Flags
Money pages with few or no external links. Your service pages, product categories and best guides should show up in the top linked pages table. If they don’t, they’re trying to rank on content alone.
Important pages with few internal links. If a page you care about sits near the bottom of the internal links table, your own site is telling Google it isn’t important.
Anchor text dominated by exact-match keywords. A profile where most anchors are “best plumber Dallas” doesn’t look natural, because people rarely link that way on their own.
A sudden spike from unfamiliar domains. Dozens of new linking sites you’ve never heard of, often on unrelated topics or in other languages, showing up at once.
How to Fix It
Cross-check rankings against links. Take the striking distance pages from section 2 and look each one up in the top linked pages table. A page ranking between 8 and 20 with few external links is your first target for a link campaign. It already has relevance. It’s missing authority.
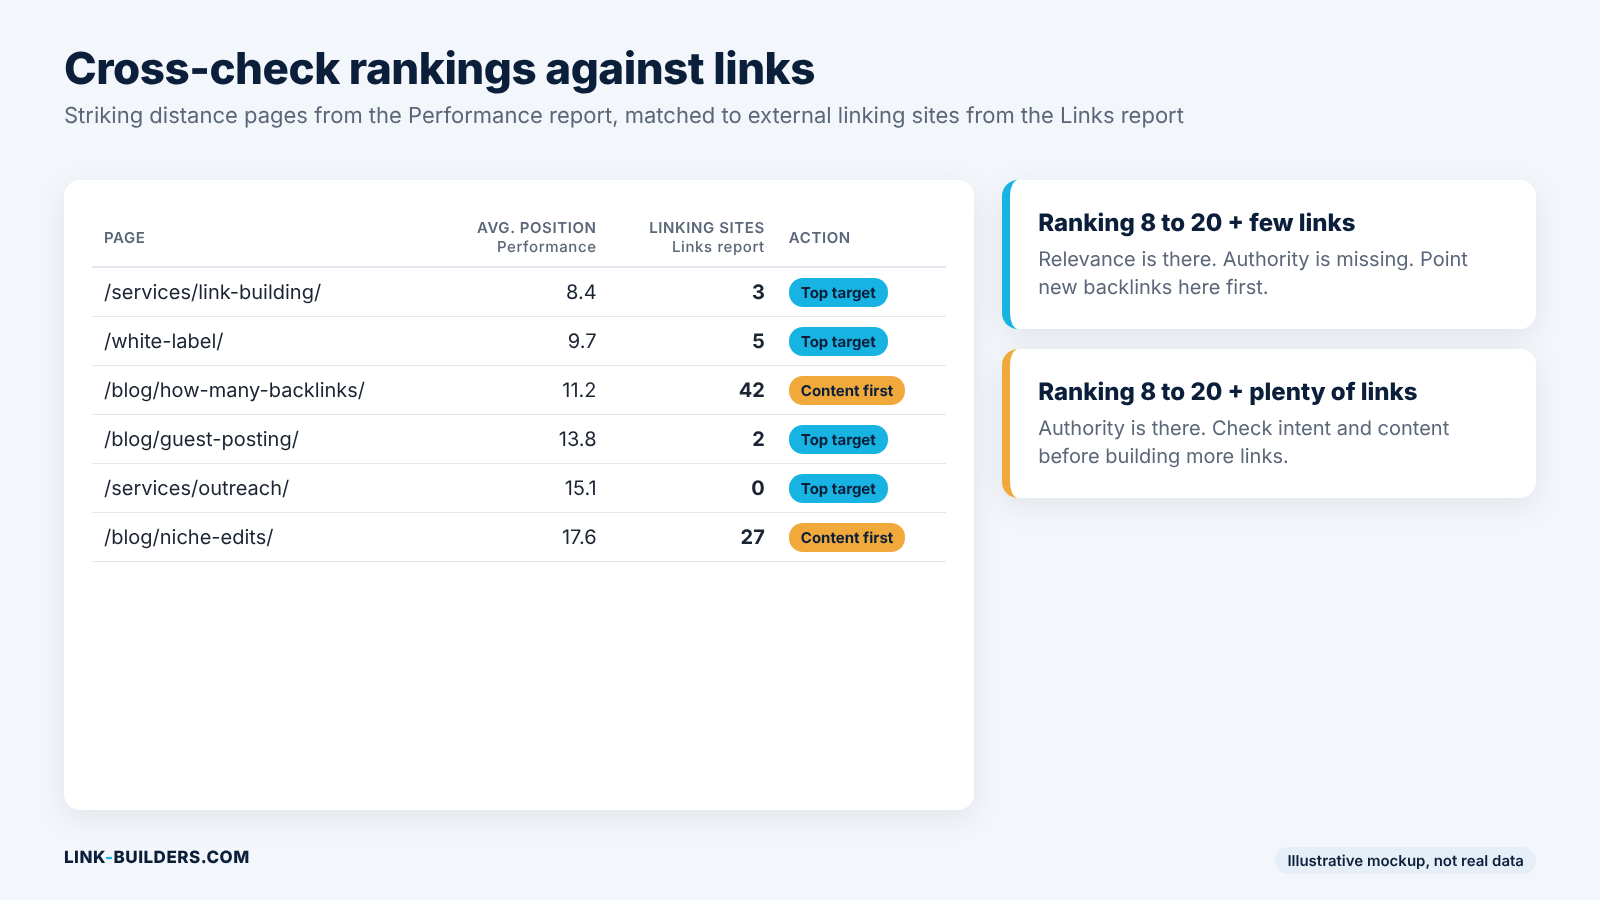
Pages ranking 8 to 20 with few links are where new backlinks pay off first.
Finding the right sites to pitch for those pages is the hard part. In What 2,920 AI-Surfaced Link Prospects Actually Look Like, I broke down what an AI-assisted search for link targets returns, and how many of those prospects hold up after a human review.
Fix internal links first. It’s free and immediate. Add links from your most-linked pages to the pages that need help, using descriptive anchor text.
Diversify anchors going forward. You can’t easily change existing anchors, but you can make future ones more natural. My articles on building a natural backlink profile and the anchor text ratio patent cover what a natural mix looks like.
Keep spam spikes in proportion. Google’s systems ignore most spammy links on their own, and its disavow guide says most sites will never need the tool. Use disavow only if you have a manual action for unnatural links, or if you know you have paid links or link schemes in your past that could lead to one. Disavowed links will still appear in the Links report, so don’t use the report to check whether a disavow worked. The disavow tool also doesn’t support Domain properties, so you’ll need a URL-prefix property to submit a file.
Not Every Link in the Report Counts the Same
A count of linking sites doesn’t tell you how much each link is worth. Google’s own patents describe systems that weigh links by where they sit on a page, how close the linking site is to trusted sources, and whether a group of sites looks independent. I’ve written about these in detail: the reasonable surfer patent, the seed site patent, and a broader look at what 7 Google patents taught me after 11 years of building links. If you’re newer to links in general, start with Link Building 101.
What Search Console Can’t Tell You
The Links report has no quality metrics, no traffic estimates and no history of lost links. It also only shows your own site, never your competitors’. For a full picture, pair it with a third-party backlink tool, and use Search Console as the check on what Google itself has found.
6. Core Web Vitals and HTTPS
Fix page speed by template, not by URL, and keep it in proportion. Core Web Vitals matter, but a fast page with weak content and no links won’t outrank a slower page that answers the question better.
Where to Find It
Go to Experience, then Core Web Vitals. The HTTPS report sits in the same section.
What Normal Looks Like
Google groups similar pages together and rates each group as Good, Needs improvement, or Poor based on real data from Chrome users. According to the Core Web Vitals report guide, a page group is Good when Largest Contentful Paint (LCP) is 2.5 seconds or less, Interaction to Next Paint (INP) is 200 milliseconds or less, and Cumulative Layout Shift (CLS) is 0.1 or less. A group’s status is set by its worst metric.
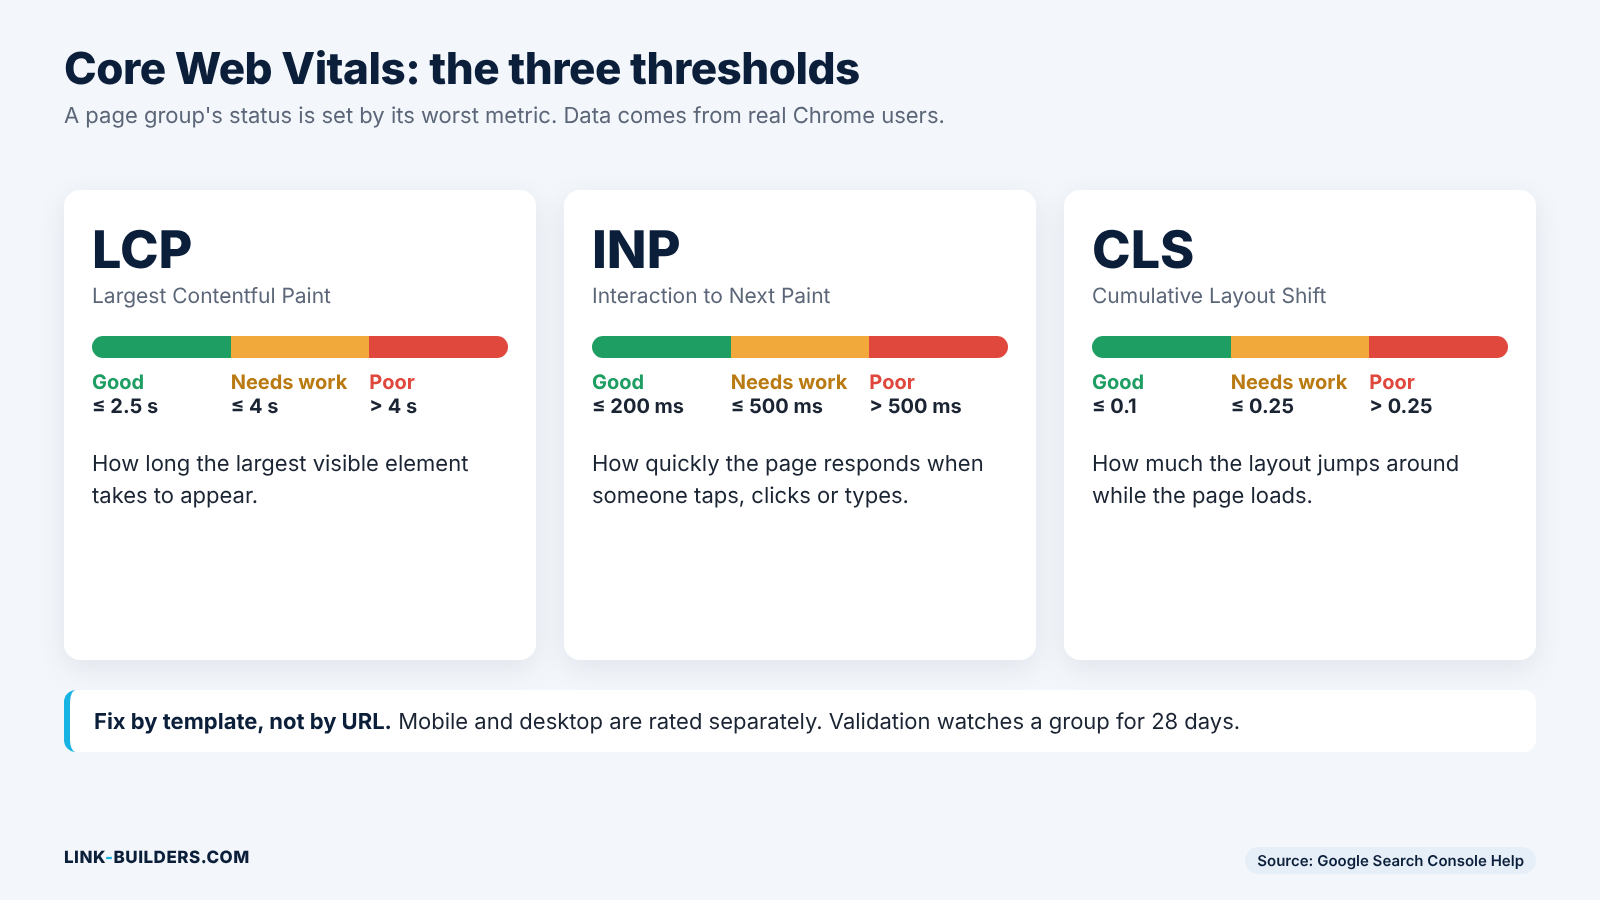
The three thresholds a page group needs to meet to be rated Good.
Red Flags
A whole group of URLs rated Poor. This almost always points to a template, such as every blog post or every product page, rather than individual pages.
Mobile failing while desktop passes. Mobile visitors usually have slower devices and connections, so problems show up there first.
Pages still served over HTTP. The HTTPS report lists any pages Google found that aren’t served securely.
How to Fix It
Fix the worst template first, or the one that covers your most valuable pages. Test changes in PageSpeed Insights, then click Start Tracking in the report. Google watches the group for 28 days before confirming the fix. For background on each metric, see Google’s page on Core Web Vitals and Google Search and the Web Vitals overview on web.dev.
7. Manual Actions and Security Issues
These two reports are short, and on most sites they’re empty. Check them first in any traffic emergency anyway. If either one shows a problem, nothing else in this guide matters until it’s fixed.
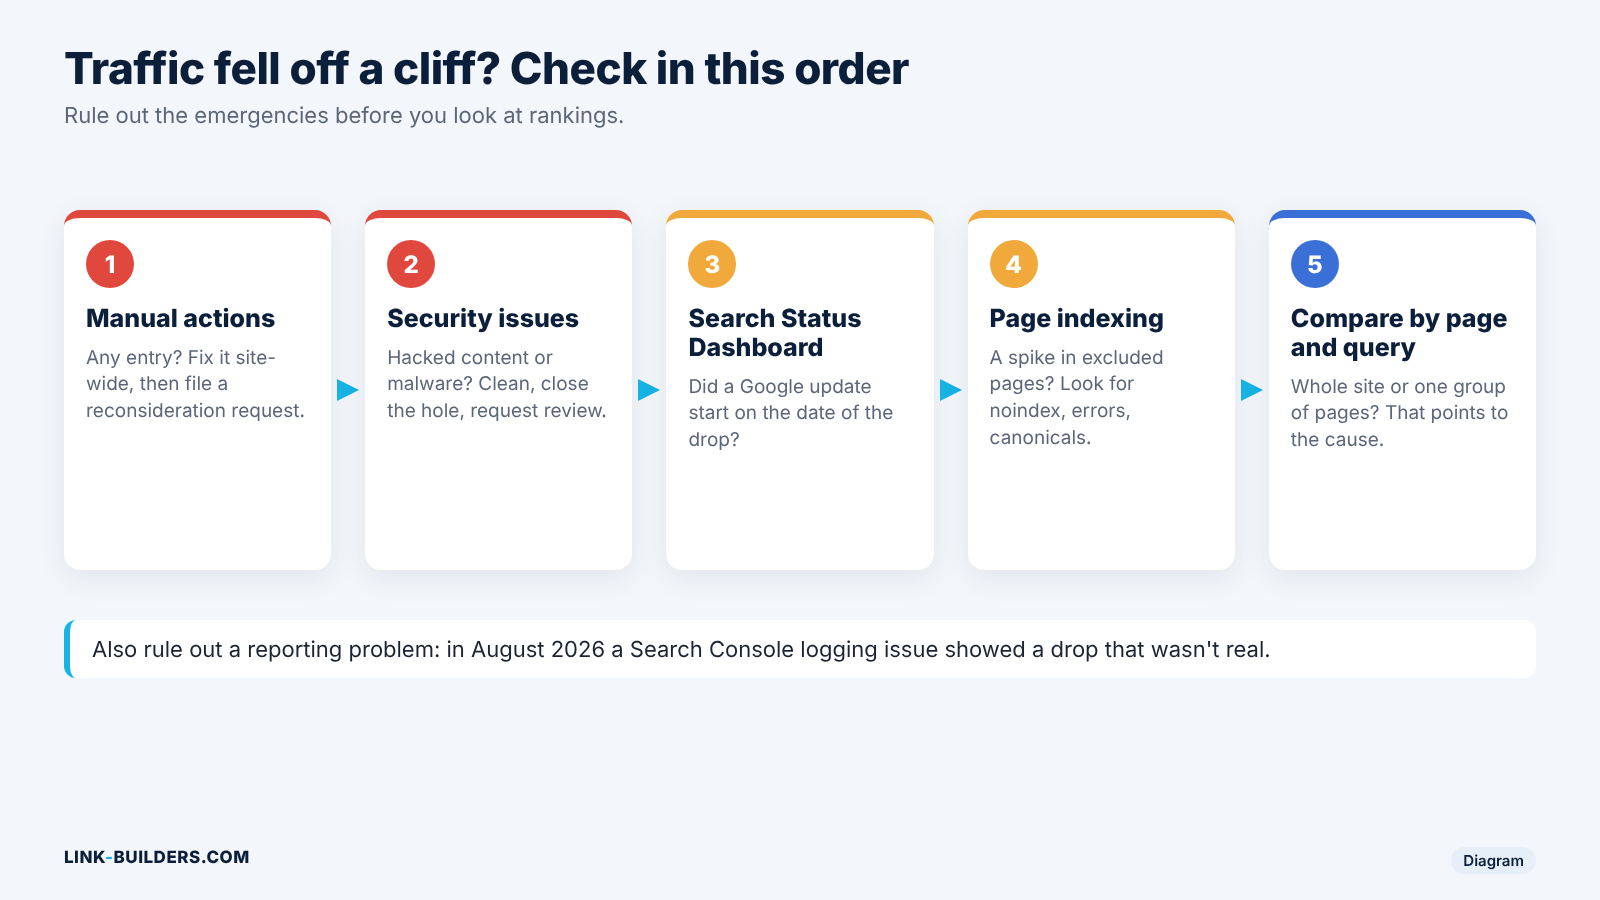
The order to check things when traffic falls off a cliff.
Where to Find Them
Both sit under Security & Manual Actions in the left menu.
What Normal Looks Like
“No issues detected” on both reports.
Red Flags
A manual action. This means a person at Google reviewed your site and found a violation of its spam policies. The Manual actions report guide lists the types, which include unnatural links to your site, unnatural links from your site, thin content, cloaking, structured data abuse and site reputation abuse. Part or all of the site can drop out of search results.
A security issue. The Security issues report covers hacked content, malware and unwanted software, and social engineering such as phishing. Affected pages can show a warning in search results or a full warning page before the visitor reaches your site.
How to Fix It
Read the relevant section of Google’s spam policies so you understand exactly what the action covers. Then fix every instance across the whole site, not just the example URLs Google lists. Partial fixes are the most common reason reconsideration requests fail.
For a link-based manual action, remove as many of the problem links as you can by contacting the sites. Disavow the ones you can’t remove. Keep a record of both, because your reconsideration request should show what you did. For a security issue, clean the site, close the hole that let the attacker in, and test before you ask for a review.
Submit one reconsideration request that explains the problem, the fix and the evidence. Google says reviews take anywhere from several days to a few weeks.
If you want to understand how Google finds these patterns in the first place, I’ve written about its link spam detection patent, its PBN detection patent, and the problem Google was solving when it made ranking changes slower and harder to read from the outside.
A Note on Search Console’s New AI Reports
This isn’t one of the 10 checks yet, but any guide to Search Console in 2026 needs to cover it.
In June 2026, Google introduced Search Generative AI performance reports. They show impressions from AI Overviews, AI Mode and AI features in Discover, broken down by page, country and date. The rollout started in the UK and, according to Search Engine Journal, reached all countries by August 31, 2026. Smaller sites may not see the reports if they don’t have enough AI impressions.
There are two big limits. First, the reports don’t include clicks, so you can see that you appeared in an AI answer but not whether anyone visited. Second, position data for AI features doesn’t mean much yet. In September, Google’s John Mueller acknowledged that position is hard to measure in a useful way for these features, and that Google doesn’t have a better answer for now.
Use the AI reports to see which of your pages are being pulled into AI answers. Then look at those pages in GA4 (section 8) to see what traffic actually arrives. If you want to show up in more AI answers, I covered the research and tactics in how to get cited by AI, and how links fit into it in building backlinks in an age of AI. I also wrote about where AI tools still fall short in what AI SEO agents still get wrong about link building.
Two other new reports are worth knowing about. Search Console now has web multimodal performance reporting for searches that combine images and text, and you can connect social channels like YouTube and Instagram to see which Google searches lead to your posts.
Part 2: Google Analytics 4
8. Traffic Acquisition: Organic Search and AI Assistants
In GA4, the first job is to isolate organic search. The second is to separate out traffic from AI tools, which GA4 still undercounts.
Where to Find It
Go to Reports, then Acquisition, then Traffic acquisition. The default view groups sessions by session default channel group. Add session source / medium as a secondary dimension to see where each session came from. Google’s Traffic acquisition guide covers the report, and its page on the default channel group explains how GA4 sorts traffic into channels.
What Normal Looks Like
Organic Search sessions trend in roughly the same direction as Search Console clicks. They’ll never match exactly, for reasons covered in section 10, but they should rise and fall together.
Red Flags
Organic sessions falling while Search Console clicks hold steady. If Google is sending the same number of clicks but GA4 records fewer sessions, the problem is almost always measurement, not SEO. Look for a broken tag, a new consent banner, or a site change that dropped the GA4 code from some templates.
A growing share of Direct or Unassigned traffic. Sessions land here when GA4 can’t tell where they came from. Mobile apps and in-app browsers often strip the referrer, and many AI tools fall into this group.
AI traffic split across three channels. On May 13, 2026, Google added an AI Assistant channel to GA4’s default channel group. It’s a useful start, but it has gaps. As Search Engine Journal reported, the channel doesn’t include Perplexity, it misses AI visits that arrive without a referrer, and traffic from one source like chatgpt.com can end up in AI Assistant, Referral and Unassigned at the same time. Google’s own AI Overviews and AI Mode are counted as Organic Search, not as AI traffic.
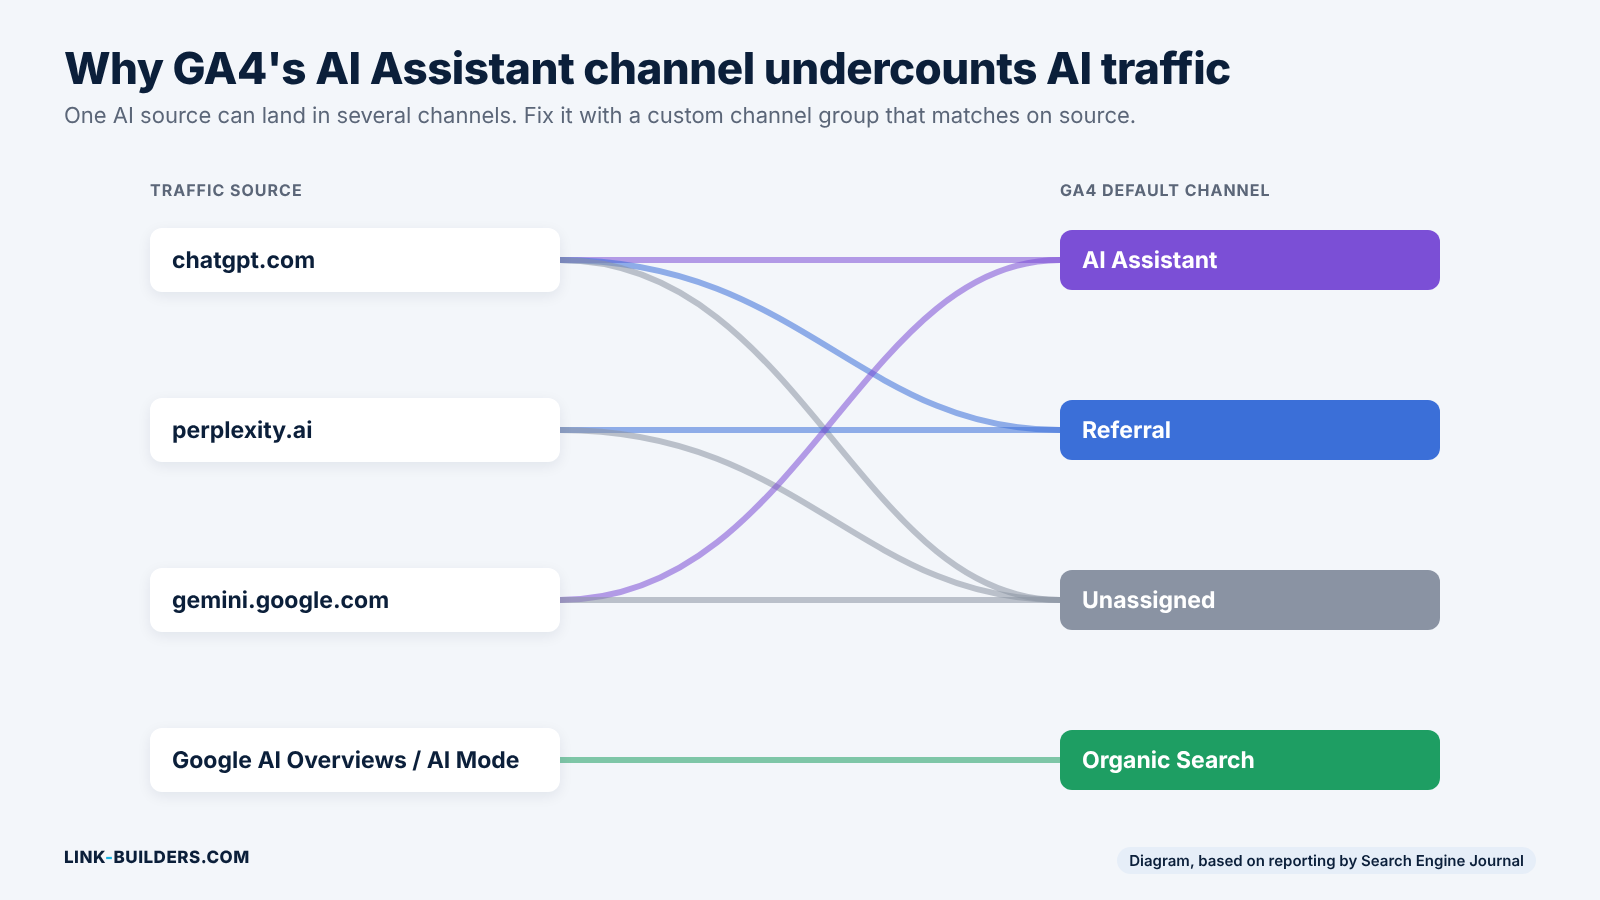
Why GA4’s built-in AI channel undercounts AI traffic.
How to Fix It
For tracking drops, use GA4’s real-time report or Google Tag Assistant to confirm the tag fires on every template, and check whether a consent change went live on the date the drop began.
For AI traffic, build a custom channel group that matches sessions by source, using a regular expression for the AI platforms you care about (chatgpt.com, perplexity.ai, gemini.google.com, copilot.microsoft.com, claude.ai and others). Matching on source rather than medium pulls the scattered sessions back together, and a custom channel group applies to your past data as well, so you can see the trend from before May. Then compare the landing pages AI visitors arrive on with the pages showing up in Search Console’s AI reports.
9. Landing Pages Filtered to Organic
A page that ranks but doesn’t hold visitors has a search intent problem. More links won’t fix it. This is the report that tells you which is which.
Where to Find It
Go to Reports, then Engagement, then Landing page. Add a filter for session default channel group exactly matching Organic Search. Then add engagement rate, average engagement time per session and key events as columns if they aren’t already there.
What Normal Looks Like
GA4 counts a session as engaged if it lasts longer than 10 seconds, includes a key event, or includes two or more page views. Engagement rate is the share of sessions that meet one of those tests. Google’s guide to engagement rate and bounce rate explains the details. Normal varies a lot by page type. A quick-answer page can have a lower engagement rate than a long guide and still be doing its job, so compare pages of the same type, not your whole site against one number.
Red Flags
High organic sessions with a low engagement rate. Many people arrive, and most leave without doing anything.
Very short engagement time on long content. If a 3,000-word guide averages 15 seconds, visitors aren’t finding what they came for near the top.
Steady traffic and no key events on commercial pages. A service page that gets organic visits but never produces a lead is either attracting the wrong searches or not giving visitors a clear next step.
How to Fix It
Go back to Search Console and look at the queries that page ranks for (section 2). Then open the page and ask whether the first screen answers those searches. Often the page ranks for an informational query while it’s built to sell, or the other way around. Rewrite the introduction to match what searchers want, move the answer higher, and add a clear next step. Only then is it worth building links to it.
It also helps to know how traffic and links relate in your industry. In my analysis of 1,000 law firm websites, the firms with the fewest backlinks averaged almost no organic traffic, which shows how much authority affects whether a page gets visitors at all. Engagement tells you what happens once they arrive.
10. Key Events, Attribution and Reconciling the Two Tools
This is the report that justifies an SEO budget, and it’s the one most often set up wrong.
Where to Find It
Mark key events under Admin, then Events. Attribution settings and reports are under Advertising. Once Search Console is linked, its reports appear in a Search Console collection under Reports.
What Normal Looks Like
Key events match real business actions: form submissions, phone calls, demo bookings, purchases. Google’s guide to marking events as key events explains the setup. Standard properties allow up to 30 key events, but most sites need 3 to 5.
Red Flags
No key events, or key events that aren’t really business actions. If page views or scrolls are marked as key events, every report that uses them is inflated.
Search Console clicks and GA4 organic sessions far apart. Some gap is normal. The two tools count different things. Search Console counts clicks on Google results. GA4 counts sessions on your site, and it only records them when the tag loads and, in many regions, when the visitor accepts tracking. Ad blockers, visitors who leave before the page loads, time zone settings and GA4’s data thresholds all widen the gap. A gap that suddenly grows is a red flag. A steady gap usually isn’t.
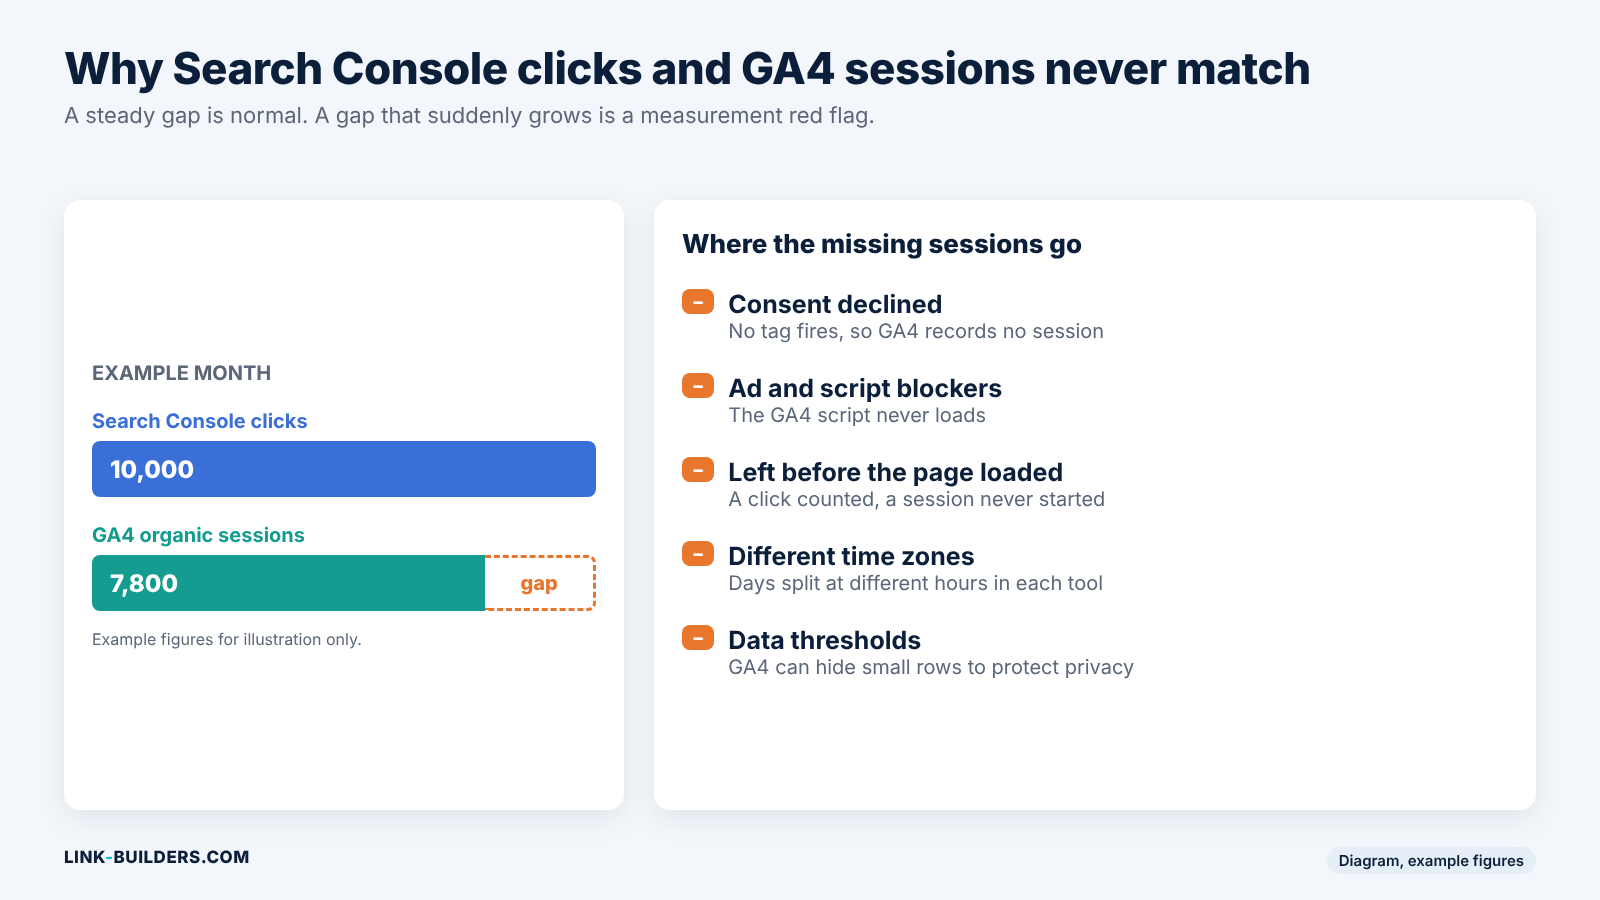
Why the two numbers never match.
Organic getting almost no credit. Under some attribution settings, organic search can look like it does nothing, even when it starts most customer journeys.
How to Fix It
Define 3 to 5 key events tied directly to revenue, and remove anything that isn’t one. Google’s guide to getting started with attribution explains the available models. Compare data-driven attribution with paid and organic last click to see how much credit organic gets under each. When you report, show organic as a trend over time plus its share of key events, rather than a single number for one month.
Reporting This to a Client or Your Boss
A one-page monthly report built in Looker Studio can pull from both tools. I’d include five numbers: non-branded clicks, the count of striking distance pages, indexed pages against pages submitted in your sitemap, new referring domains, and organic key events. Each one ties back to a check in this guide, and together they show progress well before rankings move.
Setting expectations about timing matters as much as the numbers. I’ve written about the gap between what clients expect and what SEO delivers in client expectations vs. reality. If you run an agency and are working out what link building costs to deliver, I went through the numbers in the new unit economics of white-label link building.
A 30-Minute Monthly Checklist
Here are all 10 checks, in the order to run them each month:
- Performance overview. Compare the last three months with the same period last year. Check non-branded clicks.
- Queries and pages. List high-impression, low-CTR queries and striking distance pages (positions 8 to 20). Check for cannibalization.
- Page indexing. Filter to your sitemap. Look for new “crawled” or “discovered, currently not indexed” pages.
- URL Inspection, sitemaps and crawl stats. Confirm sitemaps show Success and host status is green. Inspect your top three pages.
- Links. Match striking distance pages against their external link counts. Check for anchor or spam spikes.
- Core Web Vitals. Look for any group rated Poor, especially on mobile.
- Manual actions and security issues. Confirm both say no issues.
- Traffic acquisition. Compare organic sessions with Search Console clicks. Check your custom AI channel.
- Landing pages. Flag organic pages with high traffic and low engagement.
- Key events. Check organic key events against last month and last year.
If traffic suddenly drops, change the order. Check manual actions, then security issues, then the Search Status Dashboard, then page indexing, and only then compare by page and query.
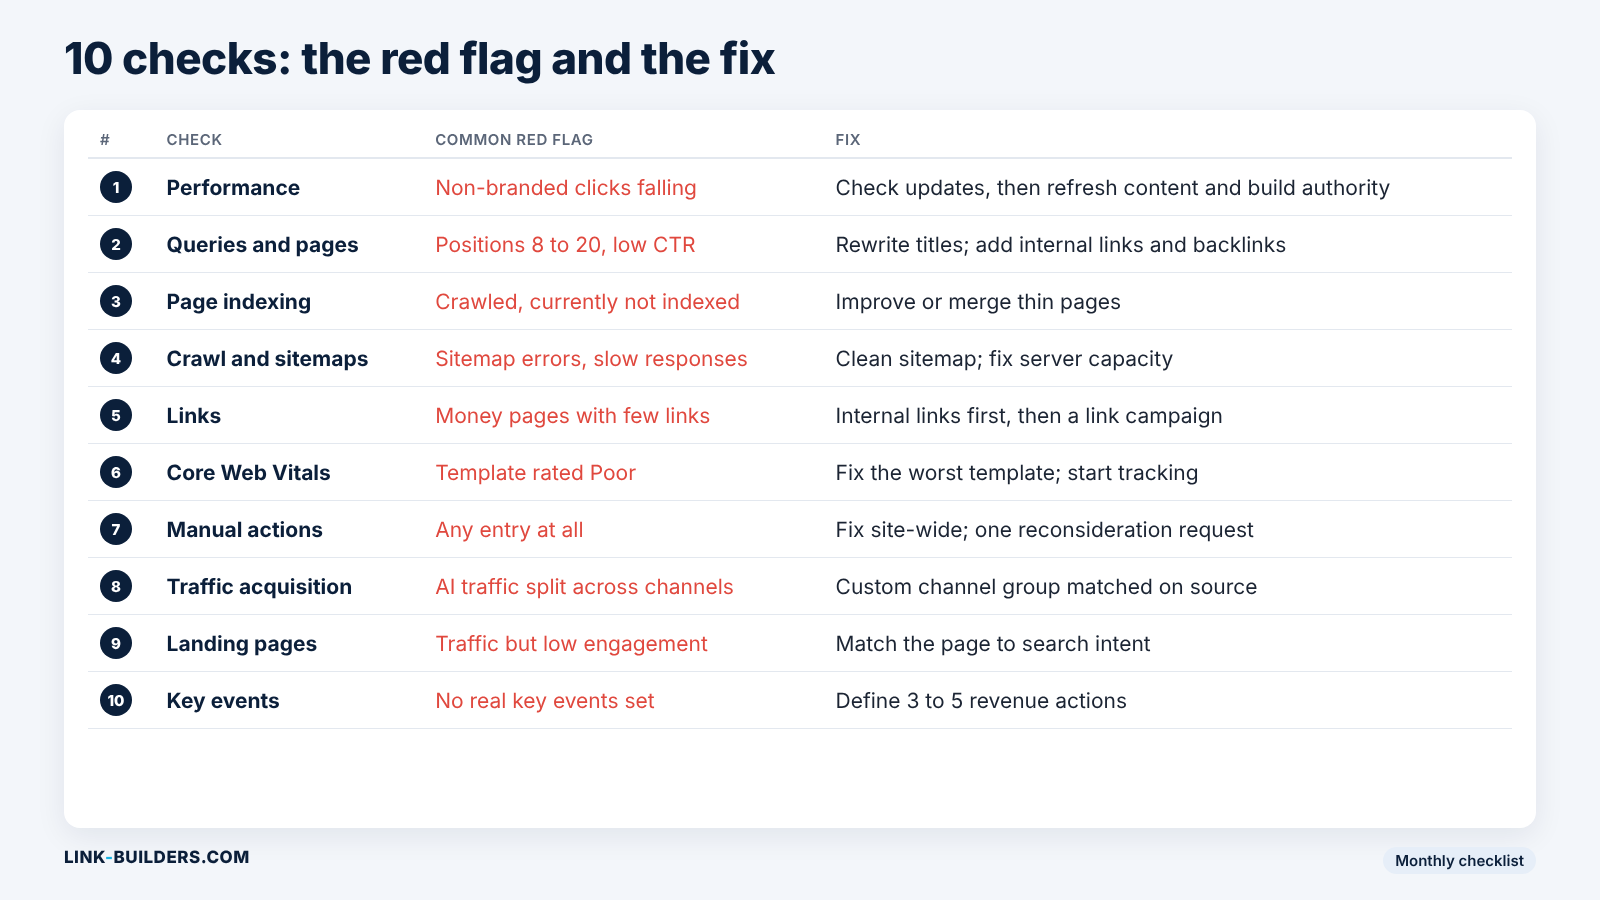
Every red flag in this guide and its fix, on one page.
Key Takeaways
- Use each tool for its own question. Search Console covers what happens before the click. GA4 covers what happens after it.
- Watch non-branded clicks. The branded queries filter makes slipping rankings visible even when total traffic looks fine.
- Striking distance pages with few links are your best link targets. Cross-check the Queries tab against the Links report every month.
- Not indexed isn’t always a problem. Focus on the pages in your sitemap, and fix quality before you ask Google to look again.
- GA4 undercounts AI traffic. Build a custom channel group by source, and remember that AI Overviews count as organic.
Need Help With the Pages That Need Links?
If your Links report and striking distance check turn up pages that need more authority, that’s the work I do. Every campaign comes with a shared spreadsheet showing every site, every reply and every price, with nothing marked up. If you run an agency and want to offer white label link building to your own clients without hiring a team, that’s the core of what I do. You can find more research and guides on the link building blog.