We Contacted 6,657 Prospects. The Response Rate Ranged From 5.4% to 27.6%
Almost every article written about AI agents and link building makes the same promise. More outreach, less labor, lower cost per email sent. Send more, get more.
Six campaigns of counted data from my own client work point somewhere else entirely.
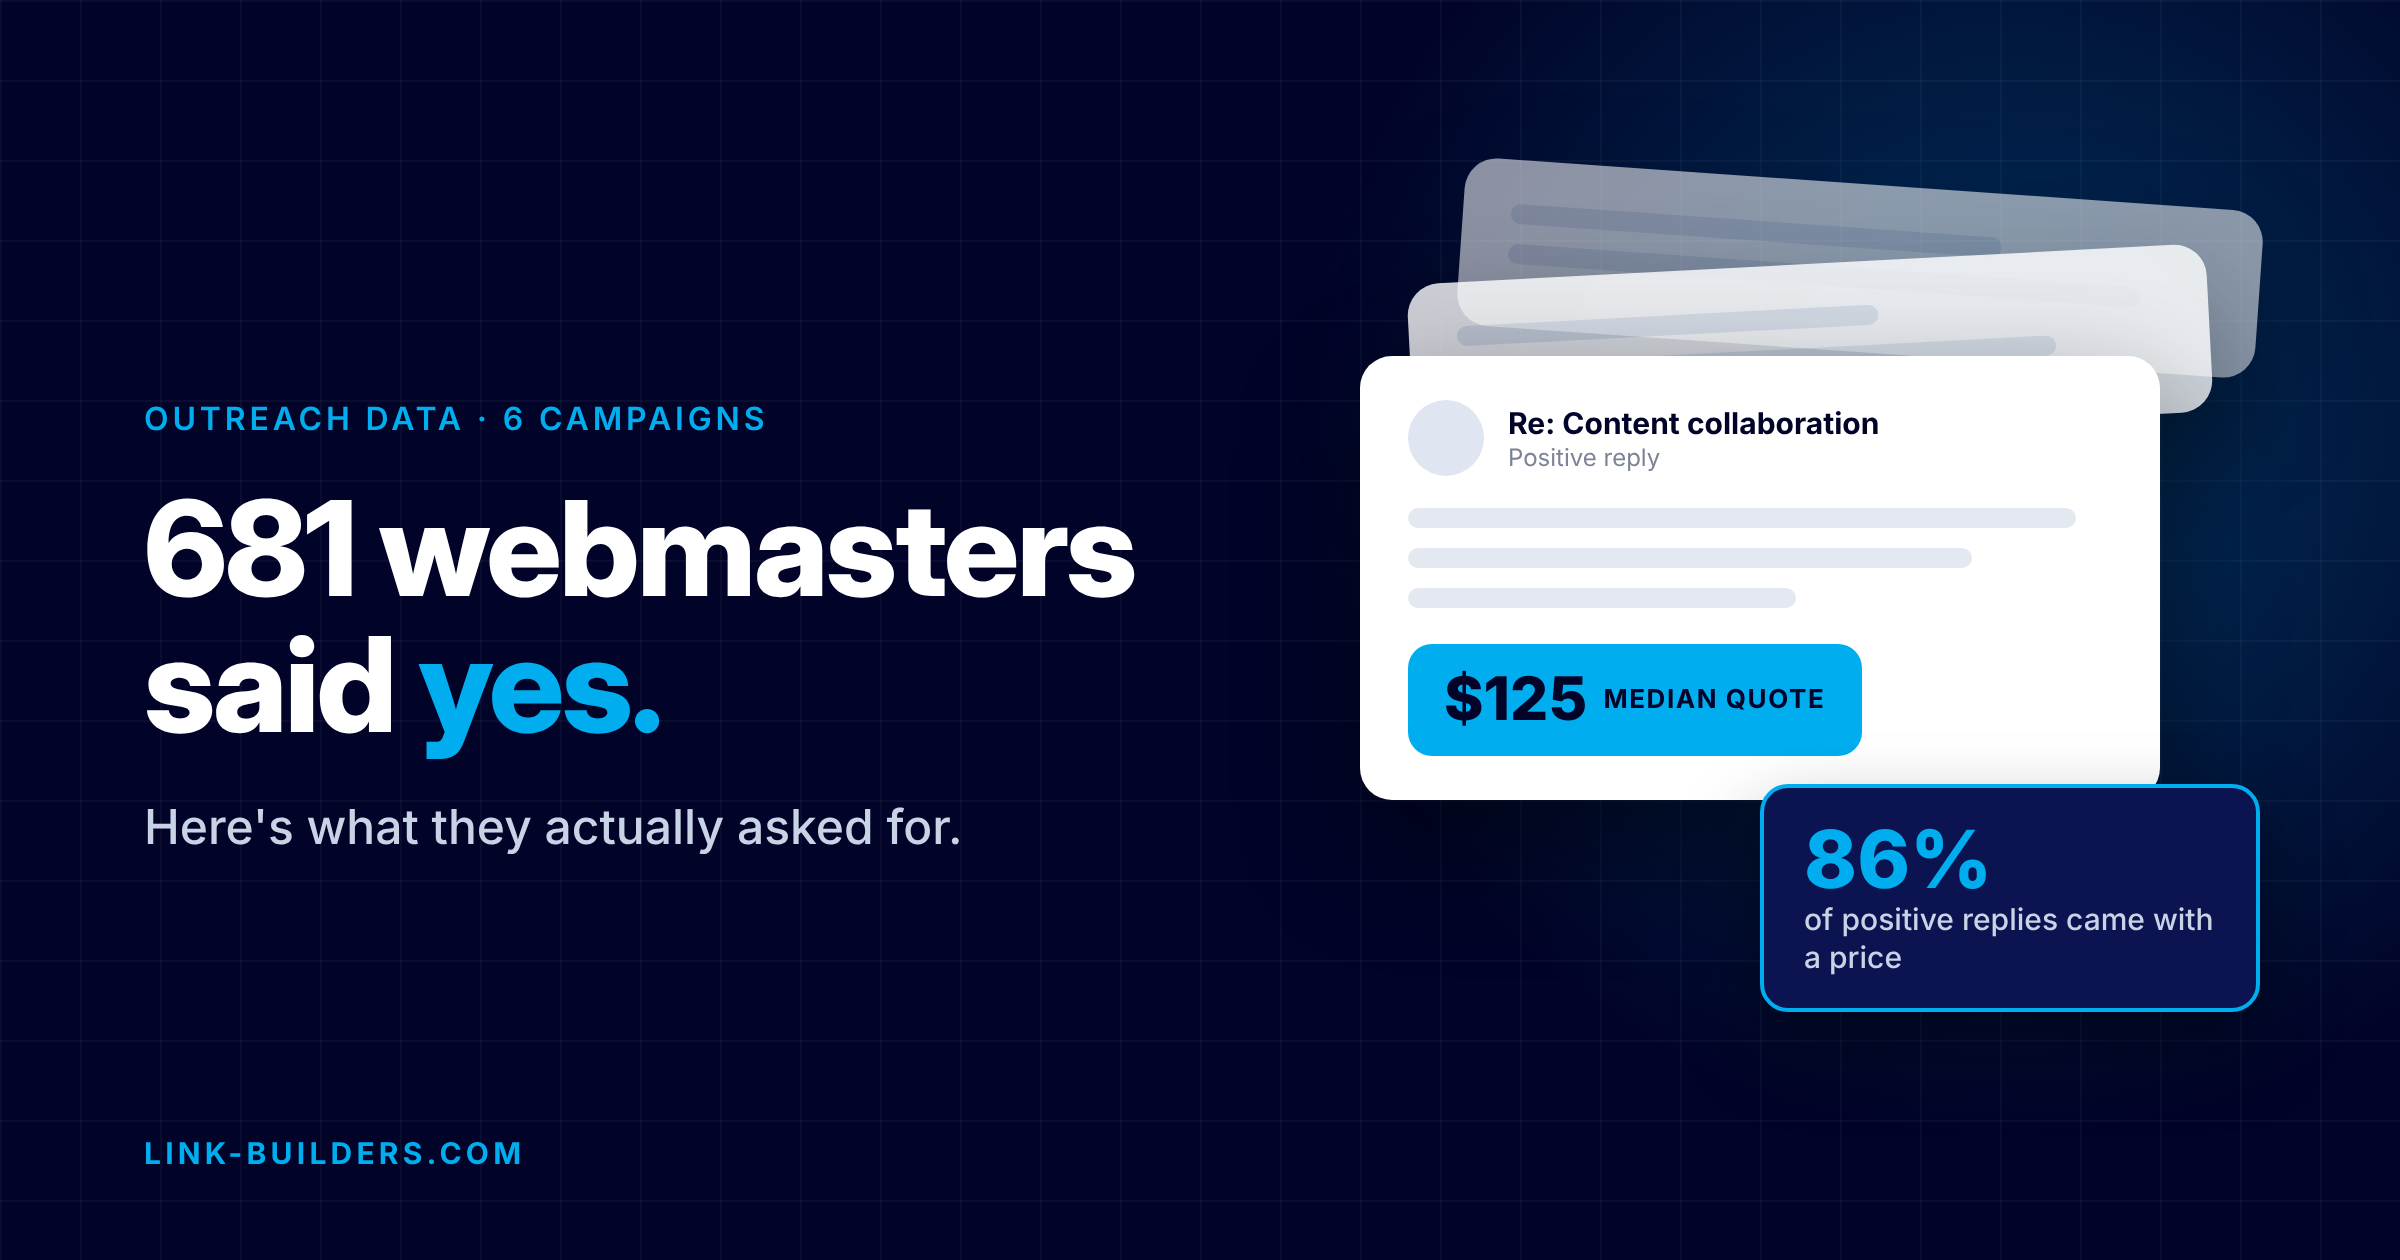
One campaign contacted 3,698 prospects and earned a 5.4% positive response rate. Another contacted 275, roughly a thirteenth of the volume, and earned 23.6%. Same operator, same process, same tools, overlapping time period. The small campaign more than quadrupled the big one’s response rate, and it converted those responses into placements at better than five times the rate on top of that.
That gap is the whole argument. Agents did not make my outreach meaningfully cheaper, because sending email was never the expensive part. What they made cheap was looking closely at every candidate page before deciding whether to contact it. Relevance filtering was always the step that produced the return, and it was always the first step to get cut, because a person doing it by hand is the most expensive hour in the process.
Below is the full table, the honest problems with it, and what the spread should change about how you build a campaign. If you want the mechanics of how the prospecting itself runs, I wrote that up separately in I rebuilt my prospecting process as an AI agent.
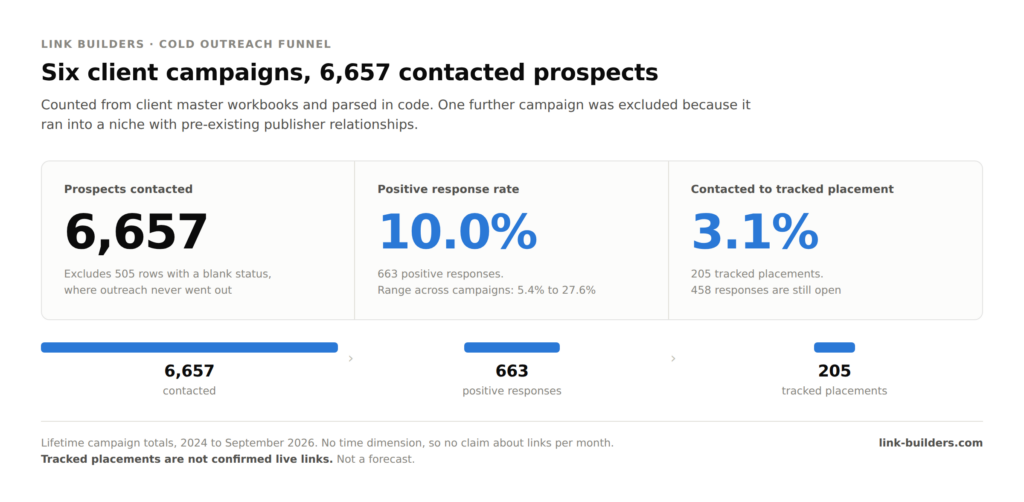
The whole funnel in three numbers. The range behind that 10% average is the part worth arguing about.
Six campaigns, 6,657 contacted prospects
These numbers come out of client master workbooks that share the same three tab structure, Link Opportunities, Positive Responses and Gained Links, which makes them comparable to each other. I parsed the spreadsheet exports in code rather than reading them by eye, because counting six thousand rows by hand is how errors end up in published numbers.
Client names are replaced with verticals. Everything else is what the sheets actually say.
One campaign was pulled out before any of this was calculated
There was a seventh campaign that qualified on structure. It ran in B2B software, contacted 341 prospects, and returned a 51.6% positive response rate, which would have been the highest figure on this page by a mile.
I removed it, and I want to be clear about why. That campaign ran into a niche where I already had working relationships with a number of the sites. The response rate it produced is a measurement of those relationships, not of cold prospecting, and leaving it in would have inflated every total below while quietly changing what the totals were even describing.
Pulling it drops the headline response rate from 12% to 10%. That is the correct direction for an honest number to move when you remove your best-performing campaign. Everything that follows is cold outreach to sites I had no prior relationship with.
The three numbers worth quoting
- 10% positive response rate across 6,657 contacted prospects
- 31% of positive responses convert to a tracked placement
- 3.1% of contacted prospects end as a tracked placement
Why the denominator is “contacted” and not “opportunities”
The raw opportunity count across these sheets is 7,162. But 505 of those rows have a blank status, which means outreach never went out on them. I used 6,657.
That is the more flattering of the two numbers, and it is also the correct one. You cannot count a non-response from somebody you never contacted. It matters that the choice is stated, though, because a response rate only means something if you know what it was divided by. Most SEO link builders publish a reply rate with no contacted count behind it at all, which makes the figure impossible to check and impossible to cite. A percentage on its own is a claim. A percentage with a denominator is a measurement.
The spread is the finding, not the average
The 10% average is the least interesting number in that table. Treat it as the headline and you miss what the data is actually showing, which is that the same process produced very different results depending on who it was pointed at.
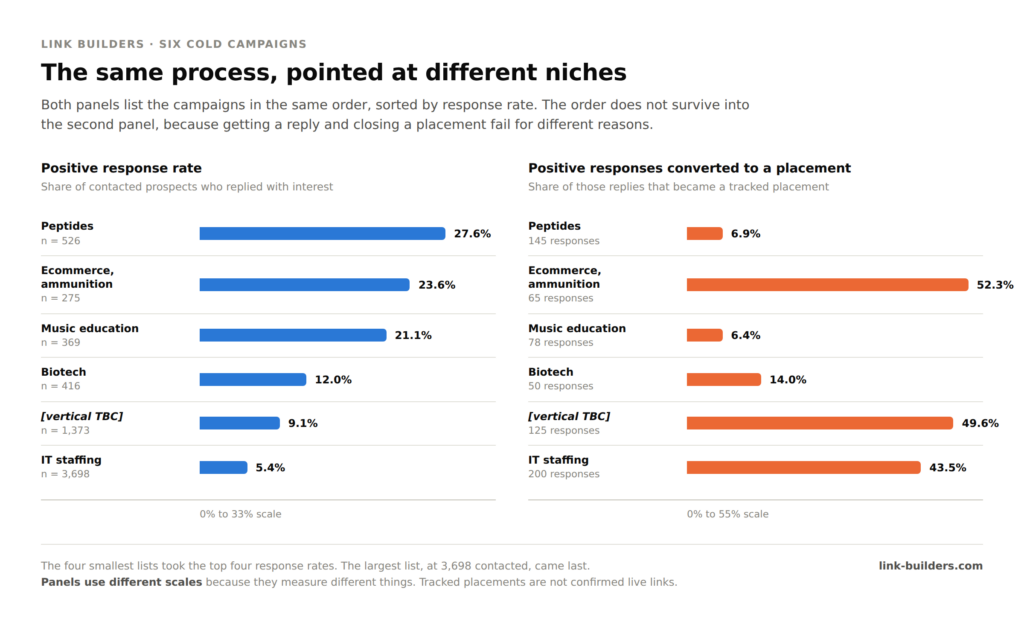
Both panels list the campaigns in the same order. The order does not survive the trip from the left panel to the right one, which is the clearest sign that response rate and placement rate are two different problems.
Three rows are worth pulling out.
Ecommerce, ammunition. 275 contacted, 23.6% response, 52.3% of responses converted. The smallest list in the set and the best end-to-end performance on the page. This is a niche with a dense population of genuinely topical sites, clubs, ranges and enthusiast publications, and the prospecting was pointed straight at them. Small list, tight fit, highest conversion in the set.
IT staffing. 3,698 contacted, 5.4% response. Thirteen times the outreach volume for less than a quarter of the response rate. It deserves a fair hearing, because it converted well once somebody replied, turning 43.5% of positive responses into tracked placements, and it produced the largest raw placement count in the set at 87. Volume is not worthless. It is just expensive per unit of attention, and this vertical is thick with syndicated and sponsored content, meaning a large share of the pages that look like opportunities are not really editorial pages at all.
Peptides. 526 contacted, 145 positive responses, 10 placements. Highest response rate on the page and one of the lowest conversion rates. That is a large pipeline that has not closed yet rather than a failed campaign, and it is a useful warning that response rate and placement rate are two separate problems. A campaign can be great at starting conversations and slow at finishing them.
What actually moved the number
The variable that changes across these campaigns is not effort, budget, sending infrastructure or copy quality. It is how closely the target page’s subject sits next to the client’s subject. That is the entire pattern. I have written before about training AI to identify quality link opportunities in your niche, and this table is the clearest evidence I have that the training is where the value lives.
Which leads to the sentence I would put on the wall. A 5.4% response rate is not a failure of outreach. It is a measurement of how many of those 3,698 prospects should never have been contacted in the first place.
In a direct comparison, the sniper approach usually has a higher success rate than the shotgun approach due to its personalized approach.
— Chris Haines · Ahrefs · Ahrefs: Shotgun or Sniper? Choose Your SEO Outreach Tactic
Filtering was always the step that got skipped
Here is why this step, of all of them, is the one that historically got dropped.
The most expensive hour in link building
Think about what a proper relevance check costs a human being. Somebody has to open the page. Read enough of it to judge whether the subject genuinely overlaps with the client’s. Check whether the site publishes anything from outside contributors, or maintains the kind of page that could hold the link. Check that it is a real publication and not an aggregator or a scraper. Then make a call.
Done properly that is one to three minutes per page. On a list of 2,000 candidates, the low end is more than 30 hours of work before a single email goes out. Ahrefs and Moz both put relevance near the top of what makes a link worth having, in their link building guide and beginner’s guide respectively, and nobody in this industry seriously disputes it. The problem was never that people disagreed. The problem was the bill.
So it got cut. When a campaign runs on a fixed budget, or gets handed to a contractor paid by the row, the filter is the first thing to go, because it is the only step whose absence does not show up until weeks later.
So the industry scaled the wrong end
The two cheapest steps to scale were always list building and sending. Both are mechanical. Both got automated first, years before anyone said the word “agent.” Lists got bigger, sending got faster, and the filter stayed exactly the same size or quietly disappeared.
That is how you end up with a 3,698-prospect campaign at a 5.4% response rate. It is not sloppiness. It is the predictable result of scaling the two steps that were easy to scale. I made the same argument from a different direction in the truth about scalable link building.
What agents actually changed
This is the part I think most coverage gets backwards. Agents did not make outreach cheaper in a way that changes anything, because sending was already close to free.
What collapsed is the cost of examining candidates before contacting them.
A few figures from my own runs that show the shape of it. Thirty-six deep queries at 200 results each cost $1.65 in SERP API charges, roughly four and a half cents a query. Running that same volume by hand through a browser triggers 20 to 30 CAPTCHAs a day, which is the friction that quietly made deep prospecting impractical for anyone doing it manually. I covered the query construction side of this in AI-powered boolean search for link prospecting.
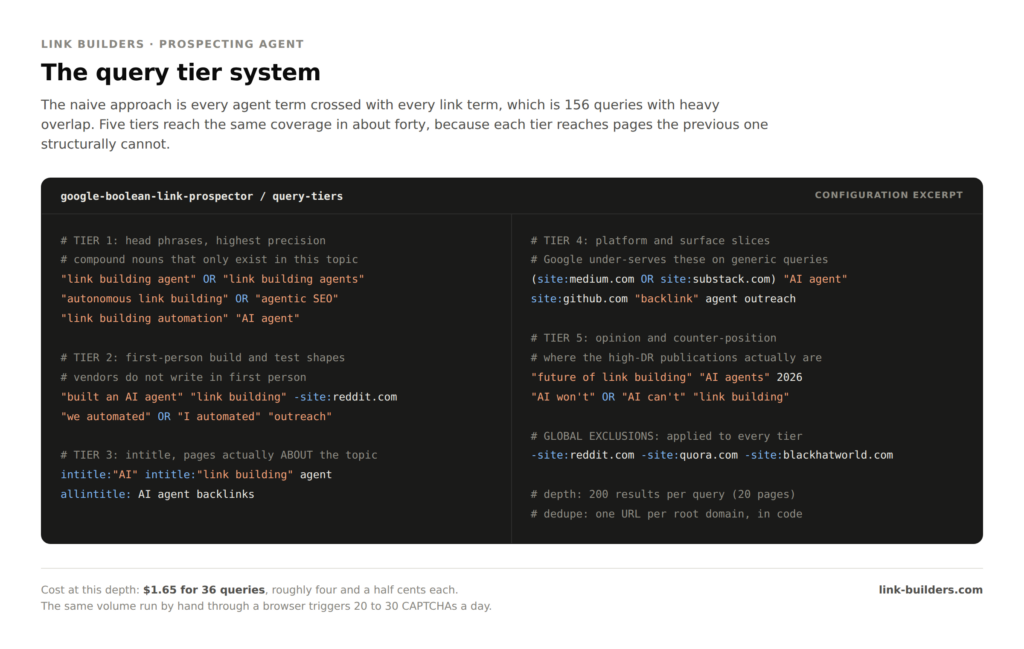
Every agent term crossed with every link term is 156 queries with heavy overlap. Five tiers get the same coverage in about forty, because each tier reaches pages the one before it structurally cannot.
On the competitor side, one large competitor can carry more than 18,000 backlinks inside a single Domain Rating band. The sift happens at page URL level rather than domain level, which is the only reason that volume is workable at all, and it is the subject of how to use AI to analyze competitor backlinks 10x faster.
On contact discovery, a 50-row test batch returned a usable route to contact on 98% of rows, with a direct email found on the page for 74% of them.
Every one of those is a coverage figure. They describe how much could be examined, not how much worked. Keeping that distinction straight is most of what separates a useful AI claim from a useless one, which is roughly the theme of what AI SEO agents still get wrong in link building.
The rule that makes those contact numbers mean anything
Emails are never guessed or built from name patterns. Only addresses actually found on a page, or returned by a lookup tool, get recorded.
That rule is why the 74% is worth reading. A workflow that constructs addresses from first initial plus last name can report a 100% hit rate and mean absolutely nothing, and plenty of them do. If somebody shows you a contact discovery number, that is the first question to ask. Google’s own link spam policies are a reminder of which side of this line you want to be standing on. Related, and worth reading if you are building this kind of system: how AI outreach QA gates protect link building quality.
What the spread should change about your campaign
If the filter is where the return lives, a few things follow.
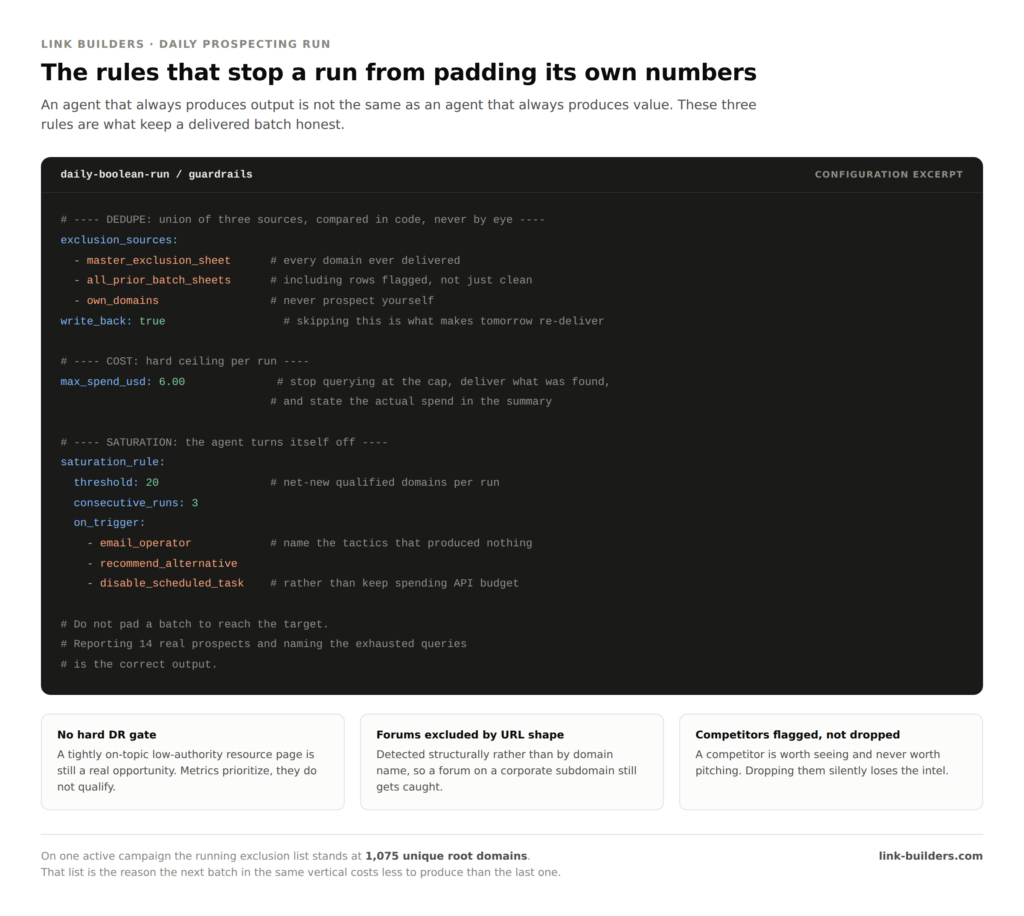
Judge a prospect list by what it excluded, not by how long it is. A 300-row list with a documented exclusion process is worth more than a 3,000-row scrape. On one active campaign my running exclusion list sits at 1,075 unique root domains. That list is an asset, and it is the reason the next batch in that vertical costs less to produce than the last one. I broke down what a real filtered prospect set looks like in what 2,920 AI-surfaced link prospects actually look like.
Measure response rate by vertical, not across your whole book. An agency looking at a blended 10% across every client has averaged away the only signal that tells them where to put next month’s hours.
Separate your response problem from your conversion problem. The peptides row and the ammunition row sit near each other on response rate and nowhere near each other on placements. Those two numbers fail for different reasons and get fixed in different places.
Read a low response rate as a targeting readout, not a copy problem. Most teams respond to weak replies by rewriting the email. Sometimes that helps, and personalization layers do move the number. But a fourfold gap between two campaigns run by the same person with the same templates is not a copywriting gap.
Ask for the denominator. Every time. From vendors, from contractors, from your own reports.
The rule at the bottom is the one most automation skips. An agent that always produces output is not the same as an agent that always produces value.
The part that does not automate
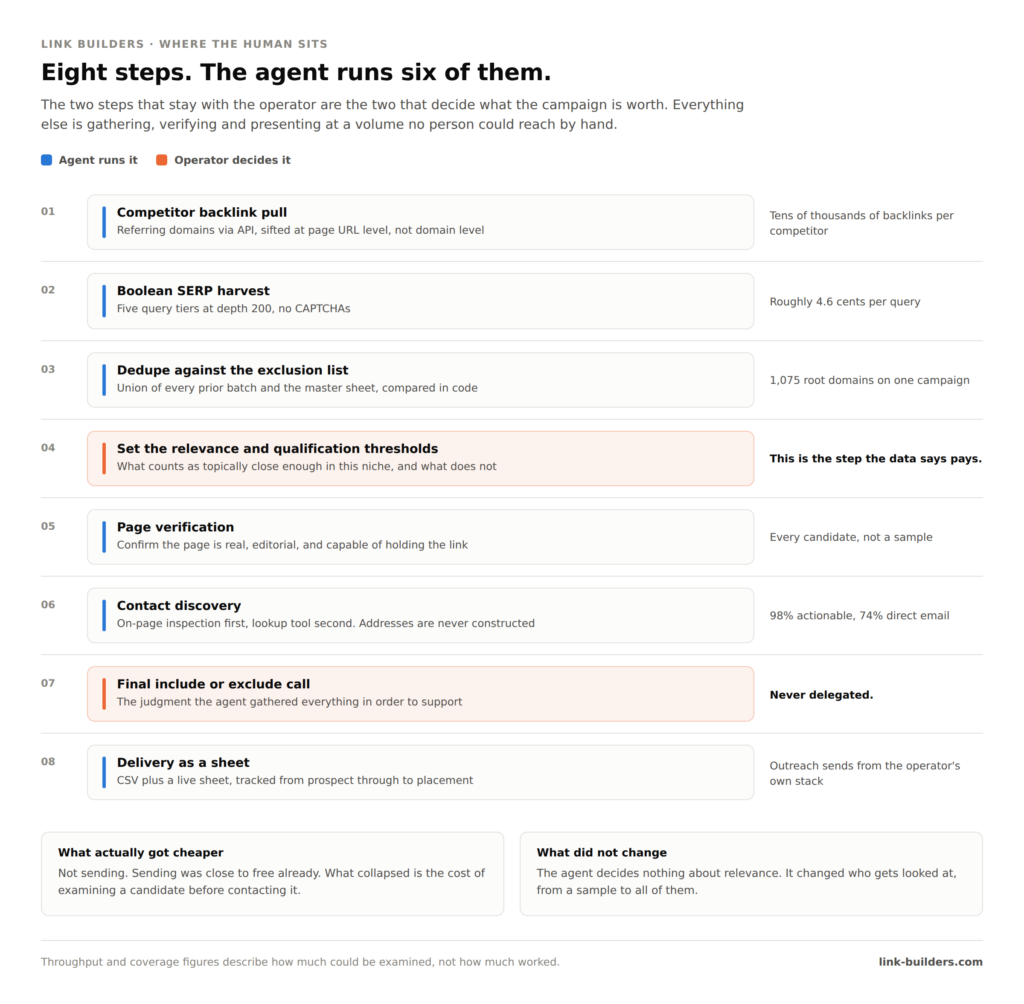
None of this means the agent decides what is relevant. It does not. It gathers, verifies and presents at a volume no person could reach, and the qualification thresholds stay with the operator. What changed is that judgment now gets applied to every candidate instead of to a sample.
Two of the eight steps stay with a person. They happen to be the two that decide what the whole campaign is worth.
Working out which steps belong to the machine and which stay with a human is its own problem, and I mapped it step by step in the 8-step link building pipeline and which steps an agent should actually run. For agencies trying to work out what this does to cost per placement, there is also the new unit economics of white label link building.
What these numbers do not say
I would rather state the limits than have somebody else find them.
These are lifetime campaign totals. The sheets span 2024 through September 2026 and different campaigns cover different stretches of time. There is no time dimension in this data at all, so nothing here supports a claim about links per month or speed to first placement. If you want my honest view on timelines, that is client expectations versus reality.
Tracked placements are not confirmed live links. Where the workbooks record link status, a good share are submitted or pending rather than verified. Across the campaigns that record it at all, 55 of 109 rows are explicitly marked live. The other workbooks do not track live status. “Tracked placements” is the defensible phrase and I am not going to upgrade it.
458 positive responses across these campaigns are still open. They are conversations that have not closed into a link or a decline. So the 31% conversion figure is measured against a pipeline that is still moving. Read it as a floor, not a final number. That also explains the peptides row, where 145 replies have produced 10 placements so far.
The tabs are not a clean cohort. A handful of domains appear in more than one tab. The three-stage reading is how the sheets were designed to work, but this is not a single group of prospects tracked cleanly through time.
None of this is a forecast. Response rates varied by more than a factor of five across six campaigns in the same shop, and that is after removing the outlier at the top. Nobody should read the 10% as a prediction of what a new campaign will produce, and that includes anybody reading this who is thinking about hiring me. I do not guarantee outcomes, for reasons I have also explained in how many backlinks can I expect.
The question worth asking about AI agents
The interesting question was never how much outreach you can send. Sending stopped being the bottleneck years ago, and every marketer in the industry already has an inbox that proves it.
The question is how many candidates you can actually look at before you decide who to contact. That is the step that used to cost real money, that is the step that got skipped because of it, and the six campaigns above are what the difference looks like once somebody sits down and counts.
If you want to see how that filtering gets applied to a specific niche, that is the work I do.
About the author

Justin Davis has been building backlinks since 2015 and has built links for more than 150 clients across law, healthcare, real estate, software, and other industries. He built the first version after years of doing the research by hand, and now builds the same workflow for in-house teams. More on who Justin Davis is, on YouTube, on LinkedIn, or on X.